
I frequently read about projections and computer simulations designed to predict how the New York Yankees or some other organization will do for the coming year, with no idea where the numbers come from. Today, I’ll introduce a relatively simple estimator from our Statistics 341 class that will help shed some light onto the formulas and concepts employed in those projections. What follows is the final project that I submitted along with good friend and teammate Mike Perrone regarding the Yankees 2012 averages. The Stein estimator can be best described to those semi-familiar with sabermetrics as “regression to the mean.” Still, it proves an interesting study in small samples.
Charles Stein introduced a paradox in 1955 for estimating the final batting averages of baseball players. The conventional thinking in statistics is that the best predictor for future events is previous events. However, in baseball, the initial small samples of at-bats prove to be a worse estimator for the season long average than Stein’s estimator. Charles Stein and W. James worked through the mathematics, and through a series of papers they proposed simple versions of the estimator. The James-Stein Estimator, or simply the Stein Estimator, proposes that through a small number of at bats, a better estimator for the true batting ability of an individual player is in a combination of his own performance and the team’s performance to that point.
In a game like baseball, where each event and play is seemingly independent of the other (given that only one player is at bat at a given time) using other players’ success rate to predict future success seems backwards. The basic principle driving the Stein Estimator is that the team average is more normalized toward the true ability of the individuals on the teams. That is, the early season luck factors or slumps are accounted for and understood with a wider lens.
As questioning statistics students, we decided to test this estimator against known final averages and test the validity of the claim that the Stein Estimator is better. We looked at both our own statistics while competing for the Division 3 Vassar College Brewers baseball team and how the New York Yankees fared last year. In manipulating the at bat sample sizes and “team average”, we were able to see how well the Stein estimator fared against initial averages across a variety of factors and found ourselves pursuing the best possible estimator.
We’ll start with an explanation of the formula. Simply, we have Z= y* + c(y-y*), where Z represents the Stein Estimator. y* is the “grand average” or team average and y is the individual’s results. We also have “c”, which is frequently referred to as the “shrinking factor.”
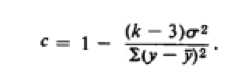
Where k is the number of players being measured in the study and y(bar) is the same as our previously mentioned y*. Meanwhile, the Greek letter sigma represents the variance in the small sample of batting averages. The shrinking factor is the defining component of the Stein Estimator. A c=1 would mean that the Stein Estimation for the season average is the current small sample average. However, Stein posits that c is never equal to 1. Further, a c of .3 means that each average would shrink about 70% of the way toward the team average (for better or worse).
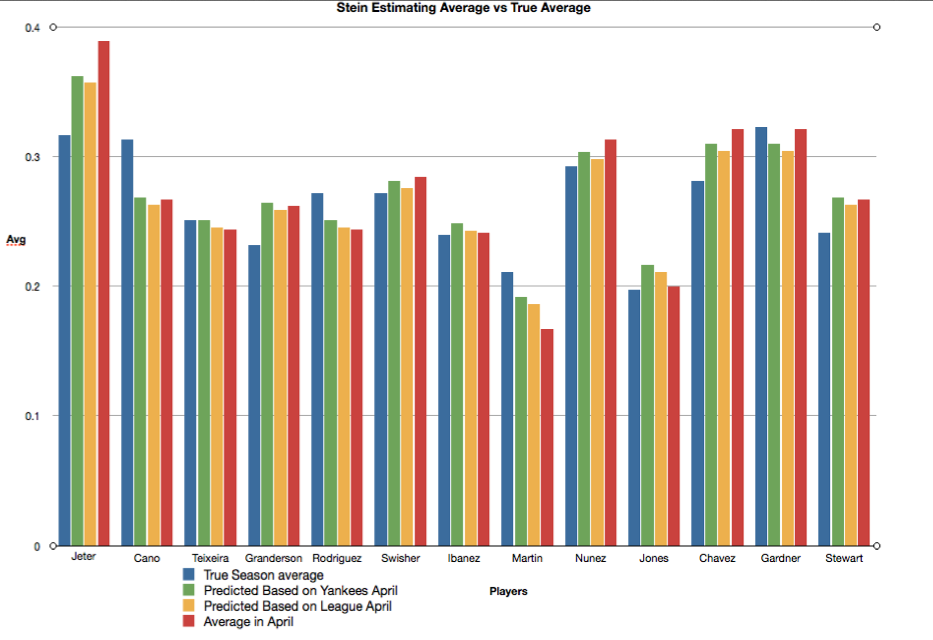
We’ll begin our study with the New York Yankees 2012. All data was acquired using baseball-reference.com. I developed the following bar graph based on that data. For simplicities sake, I used data for all of April, which represents something like 100 at bats for everyday players. You will notice the hot start of Jeter and the slow start of Martin were predicted to return to more normal averages, but their end of season averages were even further from the April averages than predicted.
Summing the differences between the end of season averages and the predicted averages, we find that the worst predictor is the real average through April (.333). The sum of the differences from the predictor with the Yankees April serving as the team average is .283. The same statistic with the entire American League functioning as the “team” average is .267 (see results below).
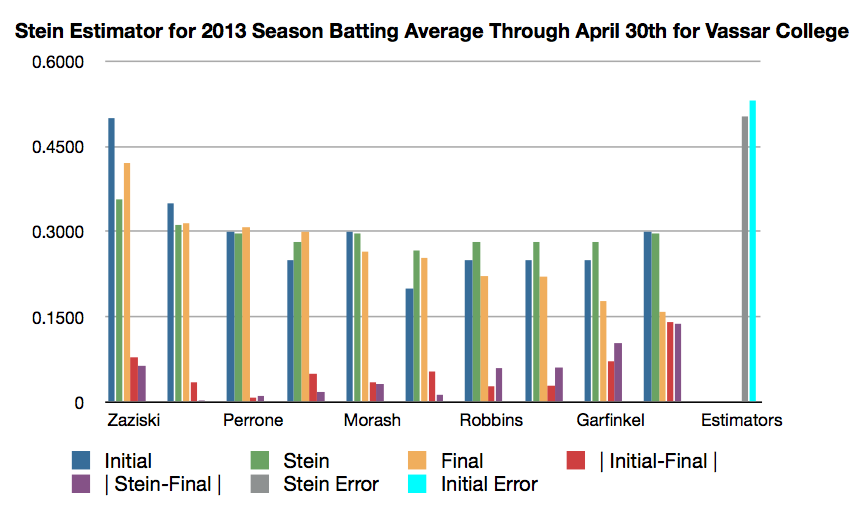
We then looked at statistics for the Vassar Brewers baseball team. We decided to look at the first 20 at bats in the 2013 season as an initial estimator. The team average through these first 20 at bats each was 0.295. Using the data we figured out the Stein Estimator average. Once we had both the initial averages and the Stein Estimator, we were able to compare these with the final averages of the season to see which one would better estimate the final average. We find that the Stein Estimator had better results in predicting the final averages than the initial average did (see the results below.)
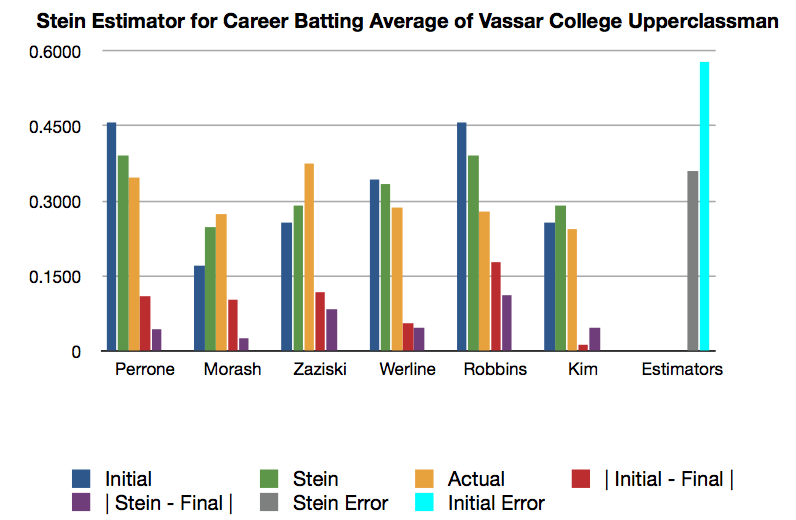
Finally, we wanted to look further into our own statistics to see if the first 35 at bats of one’s career could predict their career average. For this, we studied only the upperclassman as they had a a more appropriate number of at bats compared to the underclassman. For the first 35 at bats for each upperclassman, the grand average was 0.324. After using the data to calculate the Stein estimator, we again found that the Stein Estimator was a better predictor than the initial at bats. However, in this case, the Stein Estimator appears to be a better estimator than the 2013 Stein process (see results below.)
Based on our calculations the Stein Estimator appears to be a better predictor of final averages across the board. However, it should be noted that our mode of simply adding the differences between the estimators lends more weight to potential outliers in the initial averages. The Stein Estimator reduces the possibility of outliers and is designed to minimize each individual difference. Still, what we have found seems consistent with Stein’s findings and suggests that throughout the course of a baseball season, individuals will shrink toward the team average consistently. Further, it seems that the more information that is considered in the team average, the more accurate the estimation. Remember that the American League estimator was more accurate, and the estimator using 35 initial at bats was more accurate than the 2013 season, in which we used 20 at bats. The Stein paradox continues with this finding; even with more data about the individuals, the Stein Estimator is more accurate. In a team sport decided by individual results, it turns out that the team outcome is still important.
-Sean Morash and Mike Perrone
Stat of the Day: I’m done with classes at Vassar and that’s totally bizarre.


