
Clayton Kershaw is a renown hitter, but how do we quantify pitcher offensive performance?
Photo Courtesy of JAE C. HONG/AP
Max and I have a theory: offensive contributions from pitchers go wholly unappreciated by both the sabermetric community and old school managers alike. When watching Braves games, one could often catch the microphone next to the dugout picking up the great manager Bobby Cox yelling out to his pitchers to “take it EASY!!!” as they grounded out to shortstop. The risk of injury in running out a groundball was too great to expect hustle from Major Leaguers. Cox has moved on but the philosophy is alive and well.
Position players are expected to work on all facets of their game and nerds everywhere are constantly striving to quantify defensive value. Pitchers operate by a different set of rules; their offensive value is almost universally ignored.
In what I can tell about WAR explained on both fangraphs and baseball-reference, WAR calculations completely ignore that a 200 inning National League pitcher comes to the plate about 80 times a year. For context, removing about 80 plate appearances (or 11.7%) from Robinson Cano’s 2013 season (in which he was relatively neutral defensively) means about .8 fewer wins for the 2013 Yankees. That replacing Robinson Cano with a scrub means the Yankees win fewer games makes intuitive sense, but why don’t we care about the difference between a good hitting pitcher and a guy without a chance?
I care. And I aim to find out what pitcher offensive contribution means as we move further into the Information Age of baseball. I’m calling my statistic True Total Bases (tTB).
I have long held the theory that whether a pitcher gives up a double or a single is important to quantify his overall effectiveness. My new stat, tTB, builds off this principle. Without delving into complex matrices and calculus, I have opted to aggregate a pitcher’s total bases allowed, and subtract from that their total bases accrued while in the batter’s box. In doing this, we place an overwhelmingly weighted value on the pitchers primary job–pitching–but manage to account for offensive prowess as well.
A typical 200 inning NL pitcher will face between 800 and 850 batters. Because a pitcher is expected to face the opponents full lineup, but represents just 1/9th of his own team’s, the weighting here is perfect. A good pitcher who is a bad hitter will fare better in tTB than a bad pitcher who can mash. And that’s just the way it should be.
Turning the basic Total Bases Allowed (TBA) minus Total Bases (TB) into a per-9-innings statistic normalizes across innings totals. Our basic formula looks like this:
tTB=((TBA-TB)/IP)*9
(All those parenthesis simply mean divide by innings pitched and multiply by 9. It’s the same thing we do when we calculate ERA.)
The concept is grosslysimple: how many bases do you give up while you pitch minus the number of bases you get when you hit. But, the idea occurred to me that many pitchers are asked to bunt, and some are better bunters than others. I’m not sure of the exact totals, but it seems appropriate to reward a pitcher in tTB for getting his bunt down when his manager asks him to. Where the nerds of baseball may say that the sacrifice bunt is generally not a good idea and that it actually lessens your likelihood of scoring runs, I contend that it is not the pitcher’s fault for being a team player. The sacrifice bunt takes away from his individual opportunity to acquire total bases and should not negatively affect his tTB score. (I plan to look into the concept of the sacrifice bunt later this week). It does not seem appropriate to weight a sacrifice bunt the same as a single, so I’m going to call the sacrifice bunt a half of a total base.
Updating our formula:
tTB=((TBA-TB-.5*SH)/IP)*9
Before I complicate this idea further, here is a table of all this year’s NL playoff starting pitchers.
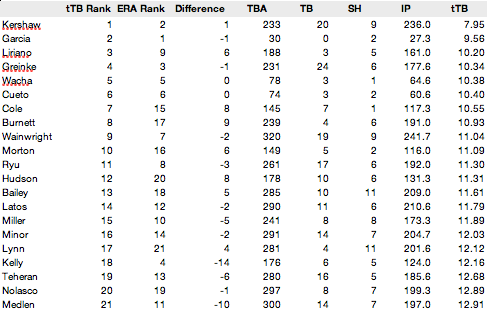
A few takeaways:
- That Clayton Kershaw finished first in a pitching statistic that I made up is good news.
- That Freddy Garcia finished second is counterintutive at first. Then, one looks at how he fared in his few starts with the Braves this year and we realize his placement is another of the Small Sample Size champions.
- Francisco Liriano’s high finish and inversely Kris Medlen’s poor standing are likely thanks to ignoring walks. As a true sabermetrics guy (now that I have made up another stat), I really should not ignore walks and am disappointed in myself for my oversight.
- Similarly, you might notice that tTB favors power pitchers such as Gerrit Cole and AJ Burnett while spurning the likes of the Cardinals’ Joe Kelly. Maybe this is just a Pirates thing.
Either way, I’m intrigued to find out what you guys think and how it compares to Max’s oERA that he introduced on Monday. One benefit of my statistic is that it is a counting stat and can conceivably be turned into a dollar amount for evaluating free agents. That is to say that each tTB means an additional $X-amount annually for a free agent pitcher. The two stats aren’t in competition, but are meant to contribute to understanding the real competition on the field. One thing, though, is certain: in the competition of baseball, pitcher offense matters.
-Sean Morash
Stat of the Day: GTM Research estimates that residential solar customer acquisition currently costs installers $0.49/W. Over the next four years, this cost is estimated to fall to $0.35/W, saving the industry a total of $619 million between 2014 and 2017.


