The Carleton WAR Challenge
I’ve never been one to back away from a challenge… unless you count physical challenges, mental challenges, emotional challenges. Okay, I back away from a lot of challenges. But nerdy, pointless baseball WAR challenges? Bring it on!
In a feat of profound geekery, I completed this challenge for all 30 MLB teams. You read that right. Not just any antisocial lunatic can obliterate an entire weekend scouring the Baseball-Reference pages of Mike Remlinger and Yorvit Torrealba. Most of you have actual social lives and obligations. Fortunately for you, I am unburdened by people wanting to hang out with me! You’re welcome.
In addition to Carleton’s criteria, I added a few rules of my own:
- Each team must have 13 position players, five starting pitchers and seven relievers.
- Only AL teams would have a DH, but that DH must have been an actual DH. For example, 2019 Matt Chapman cannot DH for the A’s to get him in the lineup with 2014 Josh Donaldson. (I used 1999 John Jaha as their DH.)
- That means that NL teams get five bench players, while AL teams get four. Benches must include at least one catcher, one infielder, and one outfielder.
- Bullpens must have at least two righties and two lefties.
- Since the Diamondbacks and Rays aren’t yet 25-years-old, I doubled up by taking two players from each of three seasons. However, I could only take one position player and one pitcher for those seasons. In other words, I could use both Randy Johnson and Luis Gonzalez from 2001, but not Johnson and Curt Schilling from the same year.
I’ll discuss the summarized results below, but you can view the full rosters here.
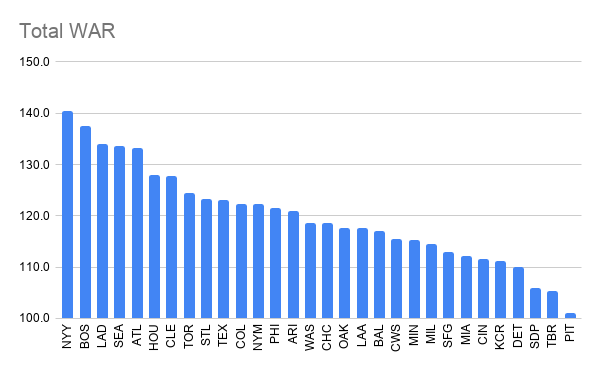
Total WAR
Here’s how each team stacked up in total WAR:
To no one’s surprise, the Yankees led the way. They featured five players with at least 8.0 WAR seasons: 2007 Alex Rodriguez, 2002 Robinson Canó, 1997 Andy Pettitte, 2017 Aaron Judge, and 1999 Derek Jeter. They also featured high WAR in difficult positions for other teams, such as catcher (2003 Jorge Posada), DH (2018 Giancarlo Stanton), and an absurd bullpen (see below).
Just as they did so often in real life, the Red Sox nipped at the Yankees’ heels. They leaned heavily on two of the greatest individual seasons by anyone over the past quarter-century: 2000 Pedro Martínez’s 11.7 WAR and 2018 Mookie Betts‘ 10.9.
The Dodgers and Braves fared well, which makes sense given that they’ve been consistently successful over the past 25 years, but the Mariners in fourth place was a bit of a shock. Nevertheless, they featured a combination of superstars (2000 Alex Rodriguez, 1996 Ken Griffey, Jr., 2004 Ichiro Suzuki, 1995 Randy Johnson) and great individual one-off seasons (2001 Bret Boone, 2013 Hisashi Iwakuma, 2018 Mitch Haniger).
At the other end of the spectrum, we have the Pirates. With only four seasons above .500 since 1992, they just lacked the star power to do well in this exercise. Their only players with more than 6.0 WAR are 2013 Andrew McCutchen and 2000 Brian Giles… who played the same position! 2000 Brian Giles heads to the bench!
The similarly moribund Padres aren’t much better, but the Rays are the second-worst team despite eight winning seasons since 2008 (not to mention their double-up rule exemption). While they’ve enjoyed a few great seasons, such as 2009 Ben Zobrist and 2018 Blake Snell, their best teams largely rely on a complete roster of good-not-great players, as opposed to a stars-and-scrubs approach. They’re sort of the anti-Mariners!
Position Players
Here’s how each team’s 13 position players (starting lineups + bench) compared:
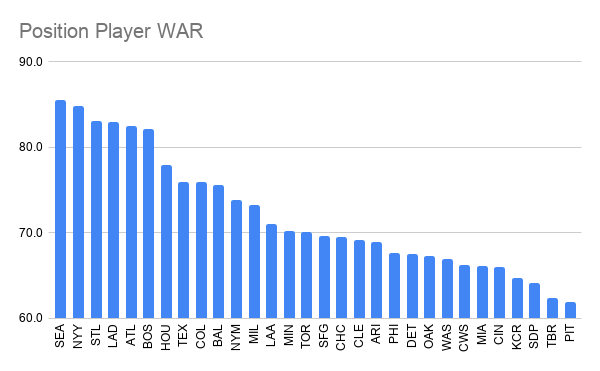
The Mariners took the top spot. Those great performances mentioned above overcame relatively weak production at catcher (1997 Dan Wilson‘s 3.8 WAR and 2012 John Jaso‘s 3.4) as well as left field (2006 Raúl Ibañez’ 4.5 WAR).
The Cardinals jumped to third place from their eighth-place showing in total WAR. 2012 Yadier Molina‘s 7.2 WAR was the fourth-best catcher season in the entire exercise, trailing the Dodgers’ 1997 Mike Piazza, the Twins’ 2009 Joe Mauer, and the Giants’ 2012 Buster Posey. Nine-win seasons from 2009 Albert Pujols and 2004 Scott Rolen didn’t hurt, either.
Once again, the Pirates, Rays, and Padres scraped the bottom. The Royals descended to their depths as well. They received only 0.7 WAR from 2007 John Buck as a backup catcher- the lowest WAR season of any position player in the experiment (despite the Rays’ prolifically underwhelming catching situation). It’s not easy to find another decent Royals catcher after Salvador Pérez, nor were there many good options to represent the 69-93 2007 Royals.
Pitchers
First, let’s take a look at the starting rotations:
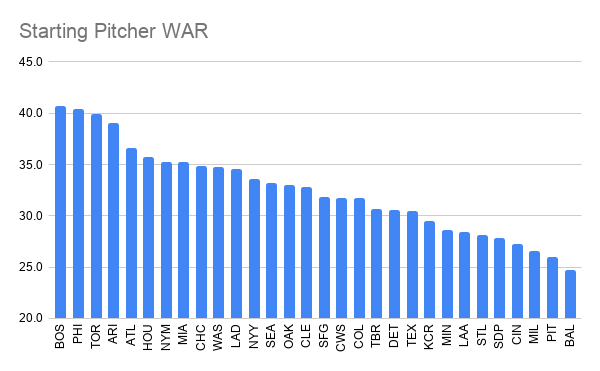
Four teams stood out from the rest of the pack: the Red Sox, Phillies, Blue Jays, and Diamondbacks. Boston received 40.7 WAR from 2000 Pedro Martínez, 1996 Roger Clemens, 2004 Curt Schilling, 2002 Derek Lowe, and 2017 Chris Sale.
The Phillies benefitted from three eight-WAR seasons: 2018 Aaron Nola, 2011 Cliff Lee, and 2010 Roy Halladay. The 12.1 WAR generated for the Blue Jays by 1997 Roger Clemens was greater than any other single-season player in the last 25 years. Unsurprisingly, four of the Braves’ starters came from the 1990s (1995 Greg Maddux, 1996 John Smoltz, 1997 Tom Glavine, and 1999 Kevin Millwood), the last was 2009 Jair Jurrjens, who contributed 6.7 WAR.
The Orioles had very few strong pitching performances from which to choose. Their best was 1995 Mike Mussina‘s 6.1 WAR, and 2007 Erik Bedard‘s 5.8 was the only other option north of 5.0.
As for the bullpens, which consisted of the top 7 player-seasons, one team particularly stood out:
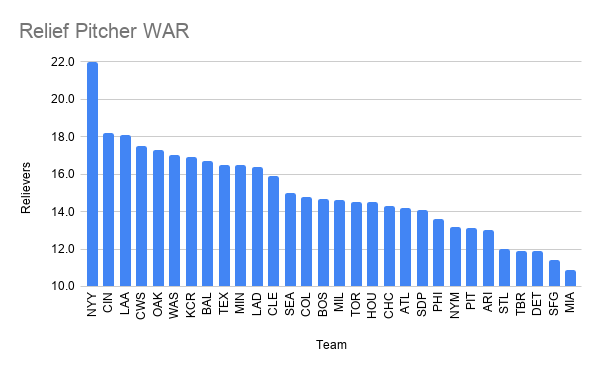
Most teams experienced several ups and downs since 1995. Usually, the relievers were culled from each team’s down years, since relievers don’t move the needle as much as starters or position players. For several of squads, it was difficult to find two competent lefties.
However, the Yankees haven’t had a losing season since 1992. There were no bad years from which I could say, “Well, let’s just pick the best reliever and move on.” Their bullpen accumulated 3.8 more WAR than the second-place Reds, which is as large as the gap between the Reds and the 20th-place Cubs.
Obviously, 1996 Mariano Rivera leads the way with 5.0 WAR. Three other Yankees eclipsed 3.5 WAR (2004 Tom Gordon, 2014 Dellin Betances, and 2008 Joba Chamberlain). For perspective, 11 teams didn’t have any relievers with more than 3.0 WAR on their roster.
Here’s the total pitcher WAR chart:
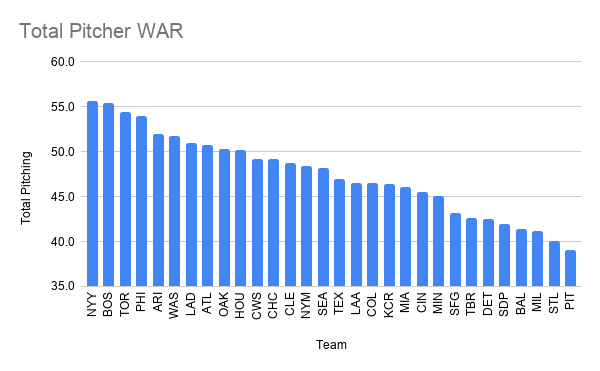
It looks fairly similar to the starting pitcher chart for the most part. However, the Yankees’ incredible relief corps accelerated them to the front of the pack.
The whole exercise is a puzzle, really. It’s a ridiculous puzzle, but a puzzle nonetheless. Here’s just one example of the decision making process: the Giants’ best shortstop season was 2001 Rich Aurilia, but that’s also Barry Bonds‘ best year. We could take 2004 Bonds instead, but Jason Schmidt was dominant that season. 2002 Bonds blocks 2002 Jeff Kent, and while we could use 2000 Kent as a replacement, that prohibits 2000 Ellis Burks. Every decision creates a domino effect.
Do you think you can do better on any of these teams? You probably can! Feel free to give it a shot if you have an hour (or a weekend) to kill.
-Daniel R. Epstein