2010 was labeled the year of the pitcher by most baseball writers and for good reason.  Run Production was way down. Major League average ERA went from 4.31 in 2009 to 4.07 in 2010, the lowest since 1992. Throughout the Majors, team average runs scored went from 747 in 2009 to 710 in 2010. That’s a 37 run decrease from one year to the next, almost a run every four games. The trend has continued this year as the average ERA is 3.85. Possible reasons for the rapid shift float around all over the baseball world. Many like to say the game is finally getting itself clean of the PED users who ran rampant in the 90s. Some say its the slew of young pitchers in the game. Some still say its the increased use of the cutter, or the culture of pitchers to share all their secrets. But, I came across an interesting possibility some time ago and think its time I share it with most of you. Before the start of the 2010 season, the Major League rulebook changed to decrease the diameter of the bat.
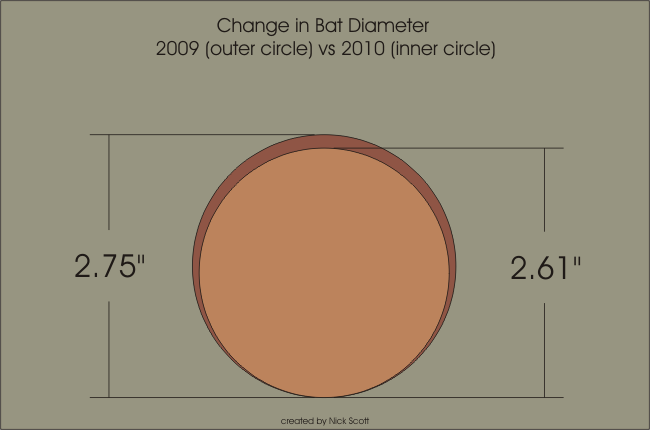
Before the change, the maximum size the bat diameter could be was 2.75. Now, if you pick up a MLB official rulebook, section 1.10(a) reads
“The bat shall be a smooth, round stick not more than 2.61 inches in diameter at the thickest part and not more than 42 inches in length. The bat shall be one piece of solid wood. Note: No laminated or experimental bats shall be used in a professional game (either championship season or exhibition games) until the manufacturer has secured approval from the Rules Committee of his design and methods of manufacture.”
Apparently, the last time the maximum diameter of the bat had changed was 1895 when the size changed from 2.5” to 2.75”. So, the allowable bat diameter shrunk by 5.1% in the off-season immediately prior to the “year of the pitcher” and it was the first time such a change had been made in 114 years. The 5.1% change likely wouldn’t affect hits on the sweetspot of the bat, such as home runs, but it makes sense that swing and misses would increase or pop outs would increase or that the balls would be hit with less authority.
Looking at those numbers: Homeruns decreased from 168 to 154 from 2009 to 2010. Thats an 8.3 percent decrease (AKA not in line with my theory). In 2009, there were 317,692 swings and 19.4% were misses (38.0% foul, 42.6% in play) In 2010, there were 315,722 swings and 19.9% were misses (37.7% foul , 42.4% in play). So, that’s an increase of 2.2% on the swing and misses (.5/19.4) and .007% increase on balls hit foul. How about Batting Average on Balls in Play, where the authority with which you hit the ball is considered? The median BABIP of all 30 teams in 2010 was right at .297. The 2010 figure sat at .299. That’s a difference of about a hit every 29 games for a whole team (AKA inconsecuential).
So none of the stats that I thought would correspond to a 5.1%change in bat diameter changed accordingly. Makes me look a bit dumb and feel like a waste of my Thursday afternoon but, I could leave it up to the sabermetricians to find the stat that shows that this shift mattered. Or it could be that the change in bat diameter did not affect the gameplay.
Baseball doesn’t make big rules changes without much of a hubbub. Remember how long it took for instant replay use to squeek its way into ballparks?  So, how was this rule change able to get by without anyone caring? Or noticing? The bureaucracy that is baseball pretty much would not allow a rule change that would affect the players either positively or negatively. They make a ton of money playing the game as it has been for the last 150 years. The MLBPA hates change almost more than John McCain.
Rob Neyer’s simple explanation as to why there was no hubbub or change in the stats that I thought would matter: No players were using bats bigger than 2.61 inches in diamter in 2009. Not one. According to Daniel Halem, Major League Baseball’s Senior Vice President and General Counsel, Labor Relations, the rule was changed to disallow big bat use in future years. Makes sense.
We’re going to have to keep searching for reasons for “the year of the pitcher” (2010) and what might turn into “the year of the dominating pitcher” (my term for 2011).
Stat of the Day: Jose Bautista has seen the fastest average fastball of any hitter this season (92.2). Is it that he’s faced some guys that throw hard or is it that guys throw harder to him because they get excited when he steps into the box? For fun, Shane Victorino sees the slowest fastballs (89.9).
-Sean Morash


