Detroit Tigers pitcher Doug Fister has hit 14 batters this year. The prolific pace figures to put him among the single season leaders since 2000 (Kerry Wood has that distinction with 21). Meanwhile, Cleveland Indian Justin Masterson has plunked 12 guys and Atlanta Brave Julio Teheran has hit 10. All that is fine and dandy, but what I noticed about these three guys is the fact that they each are having pretty good years (Fister has a 3.1 WAR, Masterson 3.0, and Teheran sports a 3.02 ERA). We generally associate the HBP with erratic pitches that missed their spot, or in the case of Ian Kennedy (10 HBP) we might have a guy who “protects his players” a bit too much. But I kept noticing some of the league’s best pitchers among baseball’s HBP leaders as well. Why?
First, I want to see if this general notion that high HBP numbers correlated with being a good pitcher before examining potential reasons for that. I found that the top 10 HBP guys had an average ERA of 3.79. For context, the MLB average is 4.23. So these top HBP guys are nearly a half run per 9 innings better, but how much of that is thanks to better pitchers pitching more innings and therefore hitting more players? So I took a look at HBP/9 innings and aside from Diamondback Joe Paterson hitting 3 guys in 2.1 innings over this past weekend, I still found that the HBP leaders were guys that I recognized. Jim Johnson, Charlie Morton and Roy Halladay all had over 1 HBP/9. What’s going on?
Historically, we know that Nolan Ryan and Pedro Martinez weren’t afraid to hit somebody and that’s part of what made them so special. They threw hard. Tried to make the batter feel a bit uncomfortable and the HBP was a component of their pitching philosophy. But, of the top career HBP artists since 1970, only Jamey Wright and Tim Wakefield have more than .5 HBP/9. And these leaders in career HBP include Nolan Ryan, Pedro, Roger Clemens and Randy Johnson. All power pitchers. But all with respectable walk rates.
So I’m left to wonder if the high HBP rates are a result of pitches gone awry, pitching more frequently on the inner half, or as some sort of peripheral stat that suggests a good pitcher (because of baseball’s complexities, I’m thinking something within the psyche of hitter or pitcher could change correlating with high HBP numbers). What are we left to do?
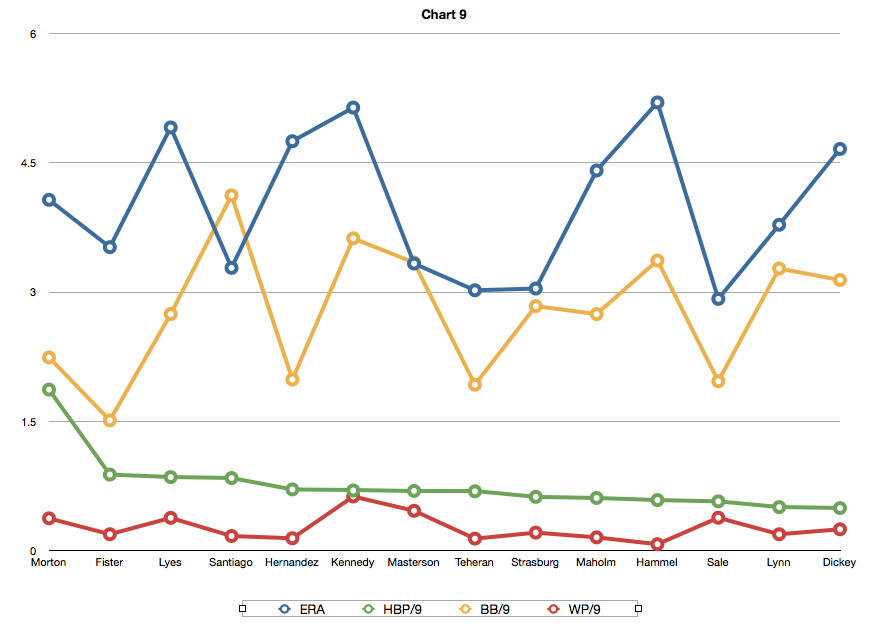
That fancy graph tells us next to nothing other than Hector Santiago hits a bunch of people (.84/9IP) and walks a bunch of people (over 4 per 9IP) and still has a respectable ERA (3.28). The rest of the guys on this list who hit a bunch of people (these are roughly the top 15 starting pitchers based on HBP/9 in 2013) and walk a bunch of people (over 3/9IP) all seem to have correspondingly high ERA’s. While the guys on this list with lower walk rates (Chris Sale, Stephen Strasburg, Julio Teheran and Doug Fister) seem to generally have lower ERA’s (Excluding the artist formerly known as Fausto Carmona). But we already knew that high walk rates generally corresponded to a high ERA so it makes sense that that trend might appear in this smaller sample.
And I still feel like I have not addressed the question of “Does a high HBP rate correspond to a low ERA?”.
So to “Correlation” we go. Here’s the correlation values (remember that correlations tending to 1 or -1 are strong and those close to zero indicate little relationship between the two variables):
| 0.145 | HBP/9 and ERA |
| -0.453 | K/9 and ERA |
| 0.313 | BB/9 and ERA |
| -0.519 | K/BB and ERA |
| 0.829 | WHIP and ERA |
| 0.798 | AVG and ERA |
So effectively what I’ve shown here is that HBP rates and earned run average don’t correspond–that putting the two together makes as much sense as sifting through my Google Searches. Unsatisfied by this (I had observed Julio Teheran and Doug Fister and Justin Masterson all with high HBP rates and low ERA’s), I broke down HBP/9 and ERA into subgroups of 10. Breaking it down as such, we start to see a correspondence emerge (r-value of .57), but that’s likely more a product of small samples and my search for a positive to my observation.
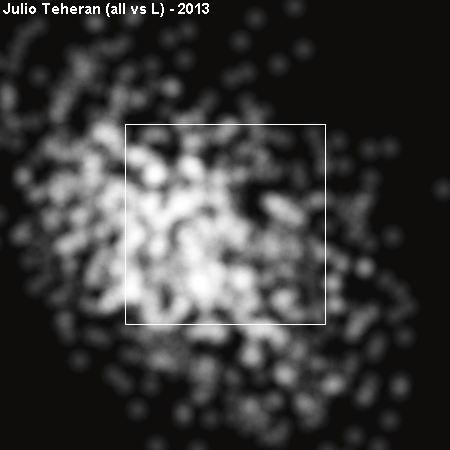
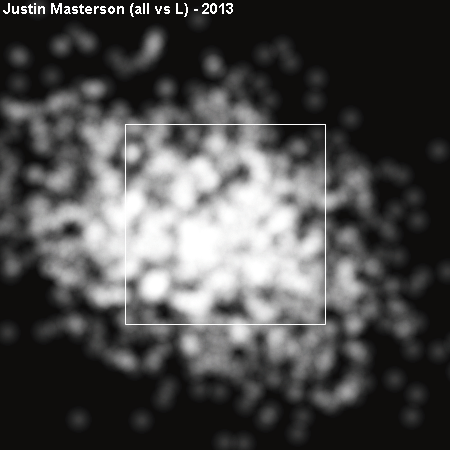
Still, why have I noticed that many of the great pitchers over the last 40 years (and this year) rank atop the HBP lists as well. I turn to heat maps to see if there’s any indication in how these guys attack hitters that may indicate a propensity to pitch inside (and miss inside).
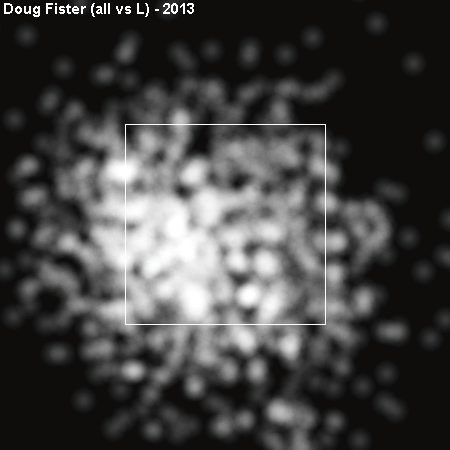 It seems like all three of these righty’s stay on the outer half when they face left handed hitters. But, let’s compare this with Bartolo Colon’s heat graph to see one of someone who has yet to hit a batter this year and is pitching effectively.
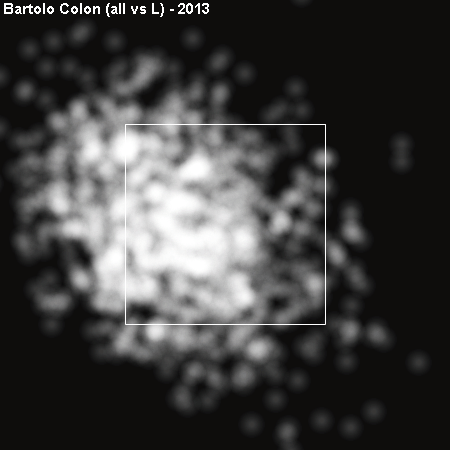 Colon likely represents the extreme as he’s also the same guy who threw something like 34 straight strikes during a game last year, but we still see that he avoids the inside third of the plate like it’s the plague. The same cannot be said of the previous three pitchers. It’s unclear how much of that is by design on all accounts, but the difference is clear. Colon doesn’t throw inside and doesn’t hit people. The other three throw inside (likely because of intent) and hit people (with varying degrees of intent).
Justin Masterson and Doug Fister lead the world in hit batsmen and both have low ERA’s this year. What does that mean? Not a whole lot. Even though I really wish it did.
-Sean Morash
Stat of the Day: The ERA’s of pitchers with at least 100 IP who have not hit a batter this year: 2.02, 2.50, 3.15. And the ERA’s of people who have hit just one batter: 1.87, 2.75, 3.02, 3.57, 4.18, 5.52. Just when you think there’s a method to the madness, there’s Ubaldo Jimenez to hit just 1 batter all year and still stink it up.

