The Angels Rotation Already Had an Ace, Garrett Richards
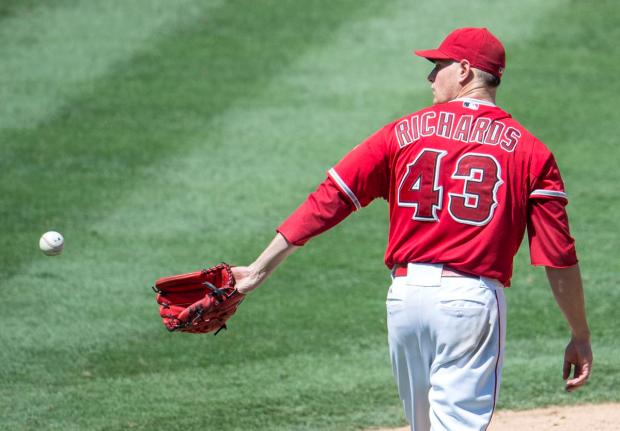
Shohei Ohtani has been getting a lot of attention in the opening weeks of the season as the savior of the Angels’ rotation, and rightfully so. The guy is throwing 100MPH fastballs with a filthy slider and splitter. So far Ohtani has looked like he has some of the best pure stuff in the league, but let’s not forget that Ohtani isn’t the only pitcher with great stuff on the Angels’ staff. For the last few years, Garret Richards has been but a beacon of hope in Anaheim. It’s been so long since Richards has had a season when he pitched over 100 innings that it’s easy to forget just how good the right-hander was when he pitched a full season. In fact, in 2014 and 2015 (the last two seasons he pitched over 100 innings) Richards was every bit as good as one of the best pitchers around, Felix Hernandez.
Any new baseball fans may not find a comparison to Felix Hernandez to be all that flattering. But in 2014 King Felix was arguably the best pitcher in the American League, finishing 2nd in Cy Young voting to Corey Kluber in a season where he collected over 6 WAR. For Garret Richards to be on par with a pitcher as elite as Hernandez during his last healthy stretch is an impressive feat, so impressive that it is not a claim that should be taken for granted. Let’s look at all the ways Garret Richards compared to Felix Hernandez in 2014, despite not placing in the top 10 in Cy Young Voting (Those Cy voters can’t always be trusted… Phil Hughes placed seventh that year!).
The Separation
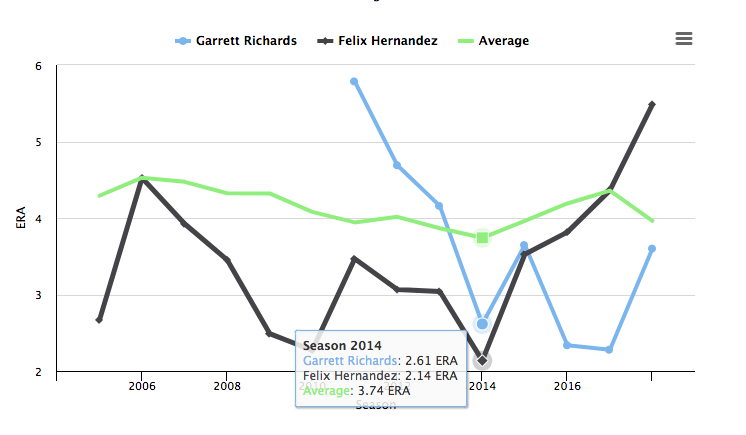
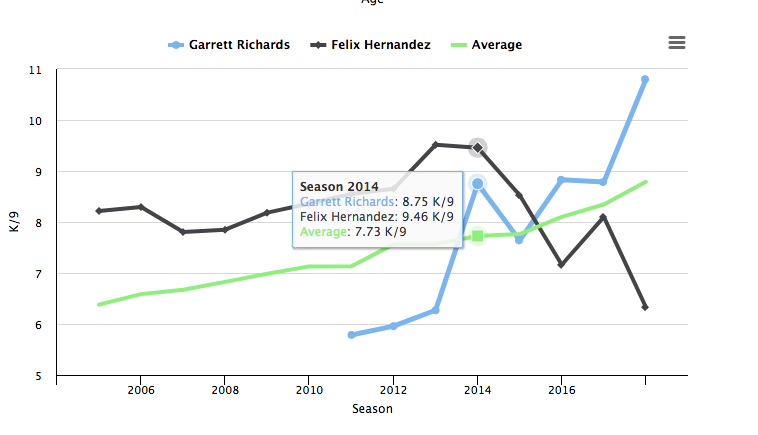
Maybe it’s a bad idea, when making a case to compare two players, to start with their differences, but I’m going to do it anyway. Let’s look at the ERA and K/9 for each of those pitchers, while both were well above average Hernandez was performing on an elite level.
Hernandez had and an ERA of 2.14 and averaged more than 9 strikeouts per nine innings. Those are ridiculous numbers. More importantly, they are the kinds of numbers that get the most consideration for Cy Young voting. These numbers are the separation between Richards and Hernandez, they’re the reason Hernandez finished second in Cy Young Voting and Richards didn’t. However, as we’ll see, that may not have been a fair evaluation of how good Richards was in 2014.
The Similarities
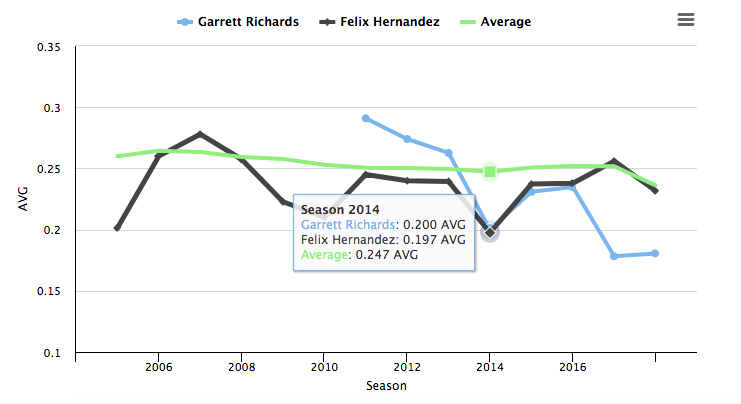
Now that we’ve seen where the two pitchers differ, in Hernadez’s elite ERA and K/9, let’s look at the more comparable stats between the two, starting with the frequency with which runners reached base. To assess that, let’s look at their batting average against, which as we can see below.
The two were nearly identical in their batting average allowed and were well below the league average of .247.
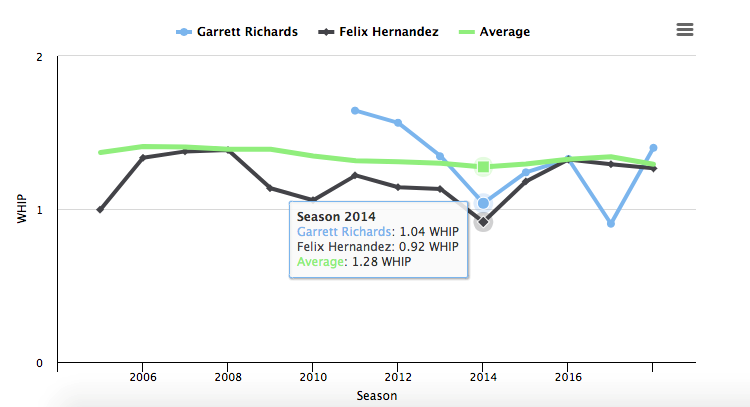
While batting average allowed is the simplest way to get an idea of how many runners a pitcher allowed on base, it does not give us the full picture. WHIP (Walks and Hits Per Inning Pitched) gives us a better idea of how many runners a pitcher allowed as it includes walks as well as hits.
As you can see the two had a very similar WHIP in 2014 and both were once again well below the league average of 1.28. From looking at both batting average against and WHIP, its clear that the two pitchers were both well above average at keeping the opposition off the basepaths.
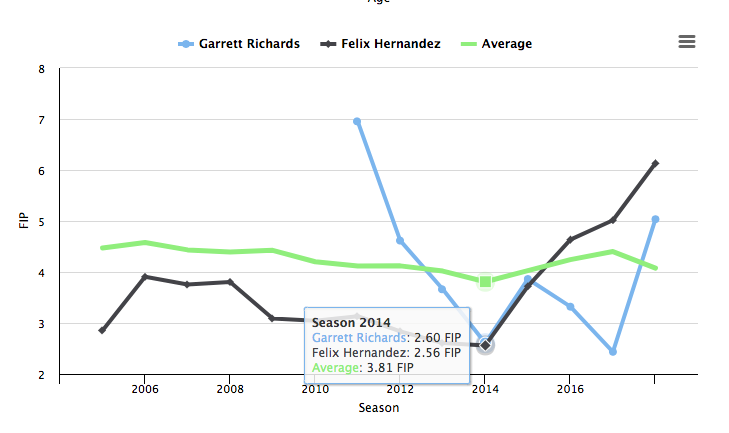
One of the best ways to analyze a pitcher’s performance independent of the team and defense that plays behind them is to check out FIP (Fielding Independent Pitching). This stat judges pitchers on the three outcomes that are completely under their control: strikeouts, walks, and home runs. Pitchers can’t control the defense behind them, thus preventing a pitcher from being in complete control over the number of hits that they surrender (a groundball up the middle could be an out or a single depending on the quality of the fielders chasing the ball). For this reason, FIP has become one of the most popular ways to compare pitchers based purely on stuff. As we can see below, Hernandez and Richards had nearly identical FIPs in 2014:
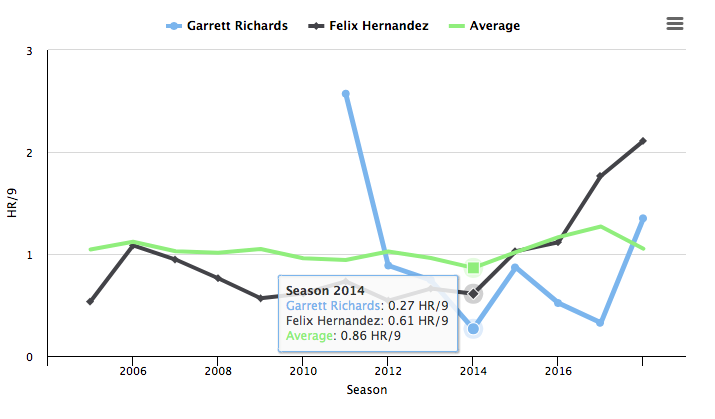
At first glance, this similarity might not make a lot of sense. We know that King Felix had over a strikeout per nine innings more than Richards did, and given their similarities in batting average and WHIP we know the two pitchers gave up a similar amount of walks. So how did Richards close the gap in FIP that Hernandez made with his strikeout numbers? The answer is in the home run rate difference between the two pitchers:
Richards gave up .27 home runs per nine innings, a truly elite number. Hernandez was certainly not prone to the long ball either, his .61 HR/9 is well below the league average but not nearly as good as Richards. With similar walk rates, Richards was able to match Hernandez’s FIP by allowing fewer home runs than nearly the entire league.
Can He Keep It Up?
In Richard’s last stretch of health, he was as good as any pitcher in the American League despite his lack of Cy Young votes. Even after accounting for the health question, you may be inclined to question if Richards’ performance can regain those 2014 levels. After all, look at what has happened to Felix Hernandez’ rate stats since 2014. He’s 29 years old, so it certainly seems like he has a chance to produce at that level again. At age 29, Felix earned himself a couple of Cy Young votes. But it’s worth taking a look at what Richards has done so far this season.
2018 may be a small sample size, but it is what we have. Garret Richards in 2018 has been a good pitcher. However, Garrett Richards in 2018 is a very different pitcher than he was in 2014.
On the positive end, in four starts Richards has:
- an ERA of 3.60, (which is good),
- a groundball rate of 56.3% (which is really good),
- and a K/9 of 10.80 (which is great).
On the bad side, Richards has:
- a walks per nine innings rate of 6.75 (really bad),
- a home run per nine rate of 1.35 (also really bad),
- and 23% of the fly balls he’s allowed have become home runs (also really bad)
While we expect those numbers to stabilize quite a bit as the season progresses, it seems like Richards has transitioned from a pitcher who doesn’t strike out a lot of batters but keeps the ball in the ballpark, to a pitcher who racks up the strikeouts while biting the bullet with the long ball.
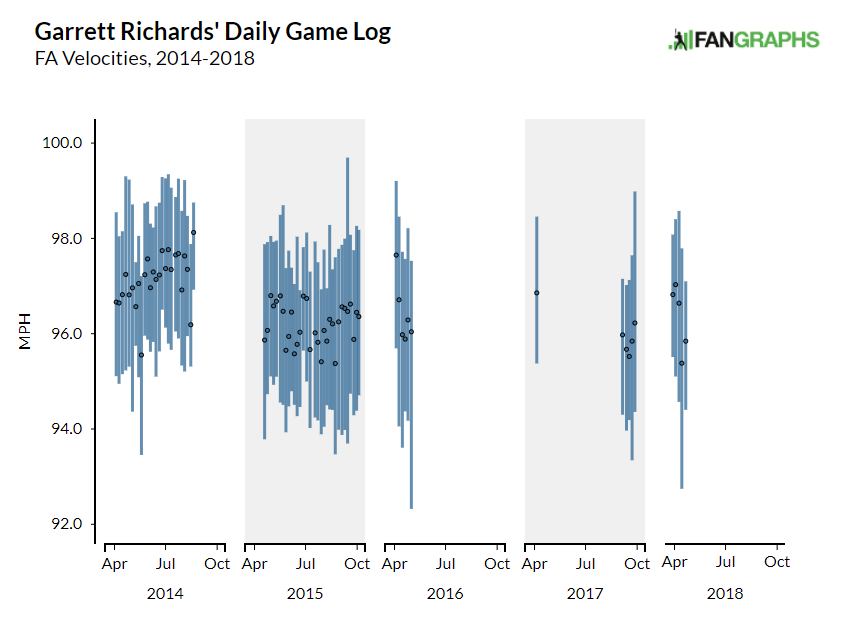
Richards seems to be a different pitcher early on this year than he was in 2014 with a high strikeout rate and high home run rate. He still throws about the same velocity.
And his pitches still move about the same amount, per brooksbaseball.net.
It seems like Richards spike in strikeouts may be related to more deception in his pitches. Hitters have swung at barely over half of Richards’ pitches that were in the strike zone (54% swing rate in K-Zone). That indicates that a lot of Richards’ pitches that are strikes don’t look like strikes to the hitter. The problem is that when hitters do swing they’re hitting the ball hard, 79.2% of the contact hitters make on Richards’ pitches qualify as medium or hard contact. If hitters make contact, they’re hitting the ball hard.
Only time will tell if Richards will manage to stay healthy this season. But if he can, the Angels will have a pitcher with a track record of elite, but underappreciated, performance. So far this year Richards has shown signs that he can still pitch at the level he did in 2014, perhaps as a different pitcher. There is some reason for concern this season (his .222 BABIP despite all that hard contact is an ominous sign). However, if he can stay healthy this season, and be of similar quality as the pitcher he was the last time he was healthy, the Angels will have another Ace to pair with Ohtani and make a dominant top of the rotation.

