Pettitte, Buehrle, and Hudson: Hall of Fame Starters
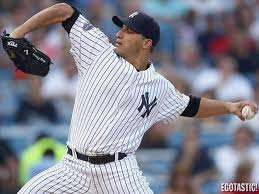
On January 26, the BBWAA will announce the results of this year’s Hall of Fame election. According to Ryan Thibodaux’s 2021 Baseball HOF Ballot Tracker, no player is currently above the 75% of the vote necessary for election, although three controversial players are closest to that mark. With 31.3% of the ballots known, the top of the tracker hosts two potential Hall of Fame starters and a great offensive force:
73.8%–Barry Bonds
73.0%–Roger Clemens
73.0%–Curt Schilling
Bonds, Clemens, and Schilling appear to be close to induction based on these numbers, but it’s important to remember that publicly revealed ballots have shown more support for all three players than private ballots. The difference last year was around 20% for the three players, which means it’s very unlikely any of the three will make it in this year.
There’s plenty that could be written about Bonds, Clemens, and Schilling, but I’m more interested in a different trio of players. Specifically, starting pitchers Andy Pettitte, Mark Buehrle, and Tim Hudson. This is Pettitte’s third year on the ballot. He received 9.9% of the vote in his first year and 11.3% last year. Buehrle and Hudson are on the ballot for the first time. This is how they stack up on Thibodaux’s tracker:
16.7%–Andy Pettitte
10.3%–Mark Buehrle
4.8%–Tim Hudson
The outlook is not particularly good for any of these pitchers, even with many years still remaining on the ballot. In fact, Hudson will need an increase in votes just to get to the 5% necessary for inclusion next year. Personally, I didn’t initially think of them as Hall of Fame pitchers when I first looked at the ballot, but I’m re-thinking that initial assessment for a couple reasons—the era in which they first pitched in the big leagues and the long trend of starting pitchers throwing fewer innings per start.
In Major League Baseball, offense has swung from low periods, like the Deadball Era and the 1960s, to high periods, like the 1930s and the mid-1990s-to-early-2000s. The graph below shows runs per game in MLB from 1901 to 2020, with high and low periods of offense singled out.
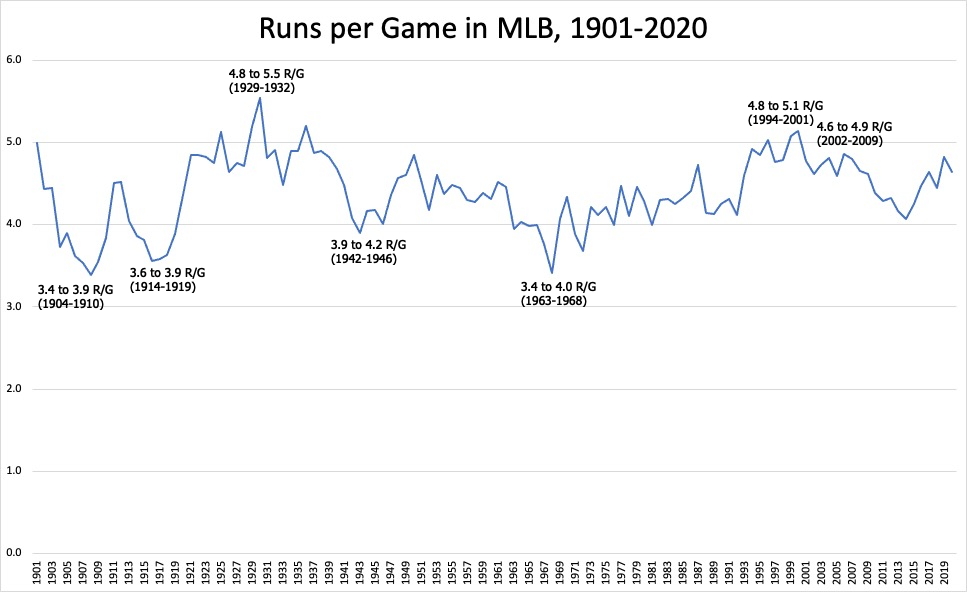
Andy Pettitte, who happens to be an OTBB favorite, made his MLB debut in 1995, right near the beginning of a long stretch of high-offense years. Hudson came up in 1999 and Buehrle came up in 2000. It was trial by fire right from the start for all three. Then, for a significant portion of their careers, these pitchers toed the rubber when opponents were scoring 4.6 to 4.9 runs per game each year and had an OPS near .750.
Contrast this with Hall of Fame starters who came up in the 1960s. Let’s use Jim Palmer as an example. He made his MLB debut in 1965 and pitched until 1984. During his career, opposing hitters had an OPS right around .700 and teams scored roughly 4.1 runs per game. The era in which a pitcher accumulates his innings needs to be considered when looking at their Hall of Fame case.
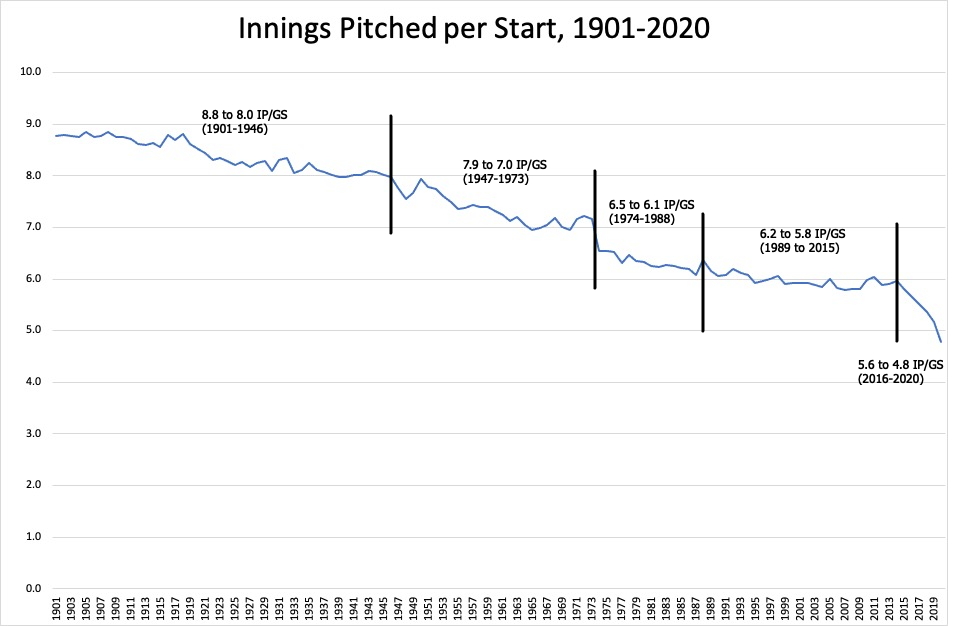
The other factor is the decreasing total of innings pitched per start over the last 120 years, which leads to fewer innings overall and fewer wins. As the graph below displays, for almost half of the 20th century, pitchers averaged between 8.0 and 8.8 innings pitched per start. Starting pitchers took the ball expecting to finish what they began and relief pitchers were an afterthought.
After World War II, innings pitched per start dropped below eight for the first time. For the 27-year stretch from 1947 to 1973, it ranged between 7.0 and 7.9. Over the next 15 years, the range dropped to 6.1 to 6.5 innings pitched per start. From 1989 to 2015, pitchers generally went about 5.8 to 5.9 innings per start, with a couple years early in that range as high as 6.2.
The most dramatic decrease has been in the last five years, culminating with pitchers averaging just 4.8 innings pitched per start during last year’s 60-game season. That may be an outlier because of the pandemic, but even in 2019, pitchers averaged just 5.2 innings per start (although I didn’t remove “openers” from the equation, so the recent averages would be a bit higher).
The combination of pitching during a high-offense era and during a time in which starters pitched fewer innings per start than pitchers of yesteryear makes it difficult to fairly judge the cases for potential Hall of Fame starters like Pettitte, Buehrle, and Hudson.
To take a deeper look at this issue, I separated pitchers based on the decade in which they were born to serve as a proxy for the era in which they pitched. The charts below include the name of the pitcher, Hall of Fame status, Wins Above Average (Baseball-Reference), ERA+, Innings Pitched, Birth Year, and Debut and Final seasons. They’re also ranked by their career bWAR. At the top of the chart is the offensive era with an estimate of the triple-slash line and runs per game during the general time these pitchers were active. The years don’t precisely track for each pitcher, but are still useful to get an idea of the caliber of offense these pitchers faced.
- Wins Above Average (WAA) is a useful metric when talking about Hall of Fame starters. These are players who should be good enough to produce more than the average player, not just more than a replacement player. Most Hall of Fame pitchers have 25 or more WAA.
- ERA+ is the league ERA divided by the pitcher’s ERA with a ballpark adjustment. This helps us compare pitchers across eras. The baseline is 100, so if a pitcher has a league average ERA and a neutral ballpark, his ERA+ would be 100. Higher is better, so a pitcher like Lefty Grove, with a 148 ERA+, was much more effective at limiting runs than Ted Lyons, with a 118 ERA+. Most Hall of Fame pitchers have an ERA+ above 115.
- The images below start with pitchers born in 1900, so there are some really old-timers who aren’t included here, like Cy Young and his arch nemesis, Old Hoss Radbourn, who has a terrific Twitter account despite being dead for 120 years.
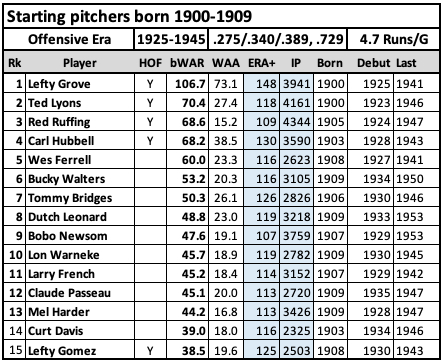
As the chart above reveals, the top four pitchers by Baseball-Reference WAR born during this decade are in the Hall of Fame. Lefty Grove is a well above the rest, with Ted Lyons, Red Ruffing, and Carl Hubbell on a different tier altogether. Even though Lyons and Ruffing have more Wins Above Replacement than Hubbell, I would put Hubbell above them based on his 38.5 Wins Above Average and superior ERA+. Lefty Gomez doesn’t compare well to the rest mainly because he pitched significantly fewer innings, but his ERA+ is better than Lyons and Ruffing.
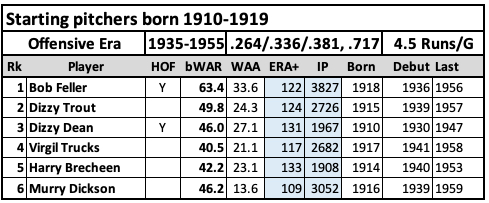
These pitchers were born from 1910 to 1919, which meant their careers lined up with World War II and, for some, this led to lower innings pitched totals than the previous group. The top pitcher here, Bob Feller, was the American League’s most dominant pitcher before he went off to war. He led the AL in wins and innings pitched from 1939-1941 and strikeouts from 1938-1941. Then he missed three-plus years while serving in WWII. In his first two full seasons back, he led the AL in wins, innings, and strikeouts again. He averaged just over 9 WAR per season in the three years leading up to WWII and around 7.5 WAR in his first two full seasons after. If not for his time served, he may have been in the 85-90 WAR range for his career.
The two Dizzys, Trout and Dean, didn’t miss any time for WWII, but Trucks and Dickson did. Dean has a low WAR total for a Hall of Fame starter because his career was short. His last season with 25 or more starts came when he was 27 years old. That was the year he was hit by a comebacker in the All-Star game and suffered a fractured toe. He came back and pitched while the foot was sore, altered his delivery, and suffered shoulder and arm problems for the rest of his career. He’s a peak candidate, with a stretch of six seasons in his 20s during which he averaged 6.6 WAR per season. Dizzy Trout is a guy I would give more consideration to, based on his ranking among his cohorts on this list. I believe this group of pitchers is underrepresented in the Hall of Fame because of the fairly high offense era in which they pitched and the interruption of WWII.
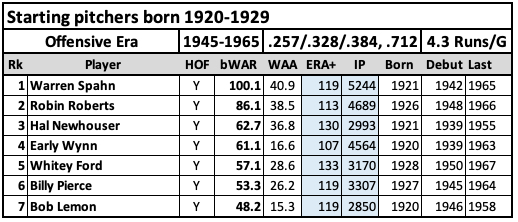
Most of these pitchers born in the 1920-1929 range debuted after WWII and pitched into the 1960s. They pitched during a lower-scoring offensive era than the previous two groups. There are a few workhorses here, with Warren Spahn pitching over 5,000 innings and Robin Roberts and Early Wynn pitching over 4,500. That’s just not a number any modern pitcher will ever reach. In this group, the top seven starting pitchers by Baseball-Reference WAR are all in the Hall of Fame.
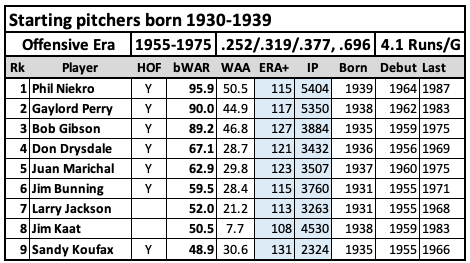
This group of pitchers features two “trick” pitchers at the top—knuckleballer Phil Niekro and spitballer Gaylord Perry. They both pitched more than 5,000 innings in their careers and piled up Wins Above Replacement and Wins Above Average. This group of pitchers had some advantages in the era in which they pitched, namely the very low-offense era of the 1960s before the mound was lowered. Even after the mound was lowered in 1969, offense in the 1970s was still lower than in the 1930s and 1990s. The top six pitchers by Baseball-Reference WAR are in the Hall of Fame, along with Sandy Koufax, who had the best ERA+ by a wide margin.
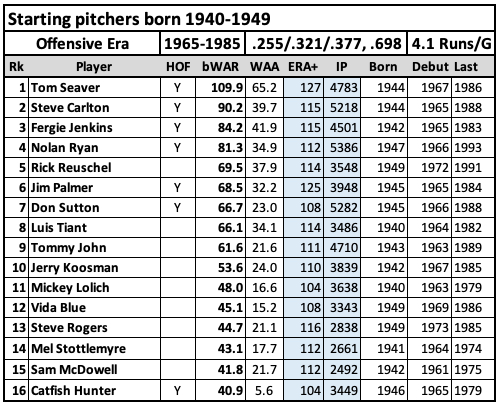
This list is extended to 16 pitchers to get Catfish Hunter included because he’s in the Hall of Fame, although it’s very questionable whether he belongs, as this chart reveals. If he was never given the nickname Catfish and instead went by Jim Hunter, would he be in the Hall of Fame with 40.9 WAR, 5.6 WAA, and a 104 ERA+? Based on the numbers, Rick Reuschel, to name just one pitcher on this list, was far more valuable than Catfish. He pitched more innings with a better ERA+ and more WAR and WAA. He also had a great nickname—Big Daddy. Like the previous group, this group of pitchers benefited from a lower offensive environment. Six of the top seven are in the Hall of Fame and I think Big Daddy Reuschel belongs with them.
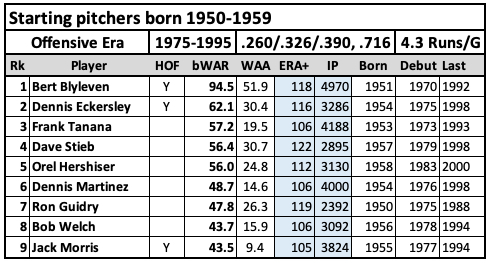
The top two starters from this group of pitchers are in the Hall of Fame, along with Jack Morris, who looks much like Catfish Hunter on paper. His Hall of Fame case was batted about in the media for years, with an old-school electorate supporting his case and new-school voters rejecting it. He didn’t make it in the Hall of Fame through the BBWAA, but was inducted by a veterans committee in 2018. I would not have voted for Morris because of his low bWAR, low WAA, and unimpressive ERA+. Among the non-Hall of Famers in this group, I think Dave Stieb has the best case.
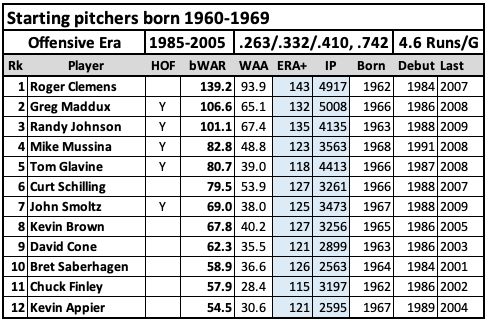
These pitchers came up to the big leagues in the mid-to-late-1980s when offense was at a sane level, but pitched well into the high-offense era of the mid-1990s-to-mid-2000s. Clemens and Schilling both have the numbers for the Hall of Fame, but both also have off-field issues that have prevented them from reaching the 75 percent needed for induction. Should they eventually make it in, the top seven pitchers born in the 1960s will be Hall of Famers.
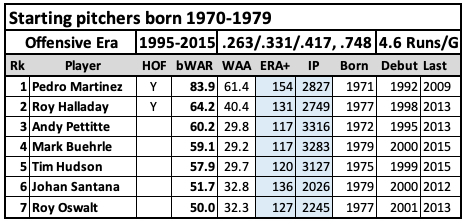
Now we get to the Pettitte/Buehrle/Hudson trio. Other than Pedro Martinez, these pitchers born in the 1970s came up to the big leagues right in the middle of an offensive explosion. Run scoring was high, balls were flying out of the park at record levels, it couldn’t have been easy to be a young pitcher coming up in 1999 or 2000. At the same time, they pitched in an era in which pitchers didn’t go as deep into games or pitch as many innings as they had in the past.
Pedro Martinez is clearly the top guy here, and Roy Halladay is very impressive, but the other five guys on this list also have good cases when compared to their peers, including Pettitte, Buehrle, and Hudson. By Baseball-Reference WAR, they’re the third, fourth, and fifth-best starting pitchers born in the 1970s. As the chart below shows, for pitchers born in previous decades, more often than not the third, fourth, and fifth-best starting pitchers made the Hall of Fame.
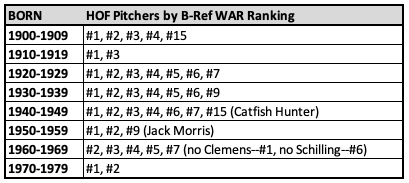
I took all of the pitchers shown in the charts above and generated some data:
- Of 56 pitchers with 50 or more bWAR—32 are in the Hall of Fame (57%)
- Of 48 pitchers with 25 or more WAA—31 are in the Hall of Fame (65%)
- Of 64 pitchers with an ERA+ of 112 or above—33 are in the Hall of Fame (52%)
- Of 45 pitchers who meet all three requirements—29 are in the Hall of Fame (64%)
The chart below shows all 45 pitchers who meet these three requirements:
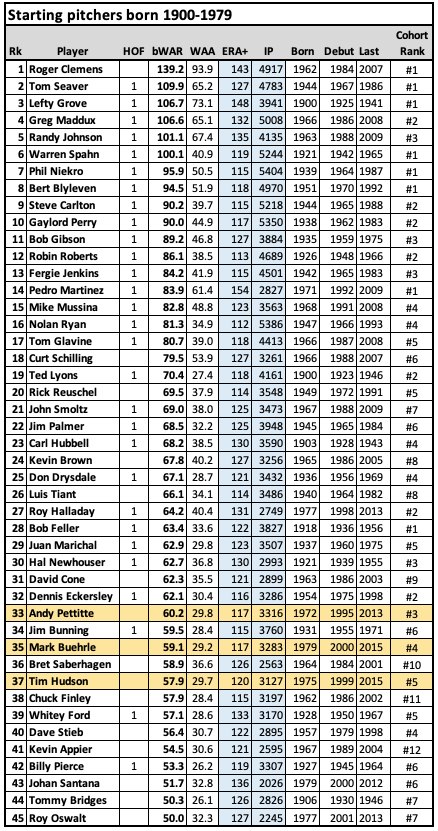
Andy Pettitte, Mark Buehrle, and Tim Hudson are on this list, right around Dennis Eckersley (HOF), Jim Bunning (HOF), Bret Saberhagen, Chuck Finley, and Whitey Ford (HOF). They are the #3, #4, and #5 starting pitchers by bWAR born in the 1970s—a generation of pitchers that is under-represented, with just two in the Hall of Fame so far. This trio is comparable to current Hall of Fame pitchers Jim Bunning, Whitey Ford, Billy Pierce, and Bob Lemon.
The obvious caveat here that Pettitte, Buehrle, and Hudson entered the major leagues during an extremely high-offense era and at a time when pitchers threw fewer innings than they had in the past. They should be judged on the standards of their time, not on how they stack up against pitchers from different decades.
I don’t anticipate Pettitte, Buehrle, or Hudson being elected by the BBWAA. Perhaps they’ll get in through an Eras committee sometime down the road when voters realize the difficult situation pitchers born in the 1970s had to endure and when it becomes glaringly obvious that there were likely more than just two Hall of Fame starting pitchers born in the 1970s.
That being said, there are starting pitchers equally or more deserving than Pettitte, Buehrle, and Hudson. Setting aside Clemens and Schilling on the list above, there’s Rick Reuschel and Kevin Brown with strong Hall of Fame cases. Reuschel had the misfortune of having seven eventual Hall of Famers the first year he was on the ballot, including pitchers Phil Niekro and Don Sutton, both 300-game winners. Reuschel received just 2 votes (0.4%). Brown’s first year on the ballot had 11 eventual Hall of Famers, including pitchers Bert Blyleven and Jack Morris. He received 12 votes (2.1%) even though he was a far better pitcher than Morris.
Two other pitchers born in the 1970s—Johan Santana and Roy Oswalt—were one-and-done on the Hall of Fame starters on the ballot, which is a real shame. Santana earned 10 votes (2.4%) in 2018. Oswalt received four votes (0.9%) in 2019. They both deserved longer looks, as do Pettitte, Buehrle, and Hudson.
-Bobby Mueller

