Evaluating RotoWire’s Two-Start Pitcher Recommendations

One of the regular fantasy baseball podcasts I listen to is the RotoWire Two-Start Pitchers pod that comes out on Fridays during the regular season. On the podcast, RotoWire’s Clay Link and Todd Zola rank the two-start pitching options for the upcoming week on a scale of zero to five, with 5s reserved for the top-notch options that should be started in every league and 0s assigned to the pitchers you definitely don’t want any part of. Pitchers ranked numbers 1 through 4 fall in the middle area between don’t-start and must-start.
I listen to plenty of fantasy baseball podcasts and they all regularly make recommendations about who to start, who to sit, who to pick up or drop, who to trade for or trade away, often based on hot and cold streaks, which can be a fool’s errand. As we should all know by now, a player is hot until he’s not and often times a hot player is added to a team’s roster just as his hot streak has ended. These recommendations can be difficult to judge, while the 0 to 5 rankings by Clay and Todd make them easier to assess. With this in mind, I evaluated how their numbered rankings for two-start pitchers matched up with the results from those pitchers for the weeks they were ranked.
I should say up front that I went into this exercise not having any idea how it would turn out. I very much enjoy the RotoWire Two-Start Pitcher podcast and the back-and-forth banter between Clay and Todd. I respect what they do and I enjoy listening to their comments on individual pitchers and their upcoming opponents. We all know predicting what a major league player will do during a seven-day period is inherently difficult.
For this assessment, I compared the individual rankings by Clay and Todd with how those pitchers did during the week of their ranking. Over the course of 19 weeks, beginning with the week starting on April 19 and ending with the week starting on August 30, a total of 641 pitcher rankings were made by Todd and 599 by Clay. For the podcast for the week of June 28 to July 4, Clay was replaced by Jason Collette. This comes out to around 33 pitchers per week. For the 18 weeks they both made rankings, they agreed 69 percent of the time. Nice.
The RotoWire Two-Start Pitcher podcast comes out on Friday and is based on projected two-start pitchers for the following week. Because baseball players, managers, and the weather can be unpredictable, not all of the pitchers they ranked ended up making two starts in the following week. Roughly 60 percent made two starts, 34 percent made one start, and seven percent made no starts.
This is something for fantasy managers to keep in mind—not all of your anticipated two-start weeks will actually be two-start weeks. As you would expect, pitchers given a zero ranking were much less likely to make two starts (roughly 40 percent made two starts) and much more likely to make zero starts (roughly 20 percent made zero starts) than the other categories of pitchers.
Before we get to how these pitchers performed, let’s look at the breakdown of ranks given by RotoWire’s Clay and Todd.

There’s not much difference between Clay and Todd when it comes to their distribution of rankings from 0 to 5. Todd had slightly more pitchers ranked 5s than Clay, but it’s not a huge difference. Interestingly, neither Clay nor Todd used the 1 ranking as often as the other rankings.
So how did these pitchers do? First, we need a baseline. The initial Rotowire Two-Start Pitchers podcast came out for the week beginning with April 19. The most-recent podcast I used for this evaluation was for pitchers projected to make two starts from August 30 through September 5. Across major league baseball from April 19 through September 5, the chart below shows how all starting pitchers performed.
- W/GS% is the percentage of time the starting pitcher earned the win per games started.
- IP/GS is the average number of innings pitched per start).

We’ll start off with the pitchers ranked by Clay. I should mention that there were a few times when Clay ranked pitchers in-between numbers, like a 2.5 or 3.5. I arbitrarily rounded down with these pitchers, keeping them in the lower group.
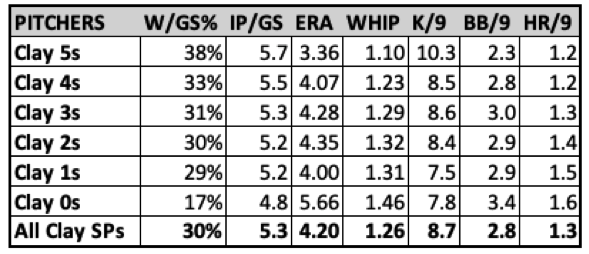
As a group, all of the pitches Clay ranked for their two-start weeks were slightly better than all starting pitchers during this time period (see the bottom row on the chart below). The pitchers he ranked as 5s were significantly better than the average pitcher and the pitchers he ranked as 0s were significantly worse. You definitely want to start the 5s and bench the 0s.
Beyond that, there’s a general trend of pitchers being less effective as their rankings drop from 4 to 0. Their rates of wins per start and innings per start fall as their rankings fall. Except for the anomaly with the smaller group of pitchers ranked as 1s, ERA and WHIP rises as the ranking drops. The strikeout rate for Clay’s 5s, 4s, 3s, and 2s is higher than for the 1s and 0s. While there’s not a big difference between the pitchers given a 3 ranking by Clay versus the 2s, the 3s were slightly better. When compared to all pitchers during this time period, RotoWire Clay’s 5s and 4s were better than average, while his 3s and 2s were right around average and his 0s well below average. The 1s were a mixed bag.
Similar to Clay, Todd’s top-ranked pitchers were excellent, greatly outperforming the baseline, and his lowest-ranked pitchers were terrible. Todd’s 4s were also quite good, better than Clay’s 4s. The pitchers Todd ranked in the 3 to 1 range aren’t as distinct. Todd’s 2s, 1s, and 0s had a lower strikeout rate than the 3s, 4s, and 5s, as you’d expect. His 3s had a better strikeout rate and WHIP than his 2s and 1s, but a lower percentage of wins per start and a higher ERA. With their 1.38 WHIP and 27 percent Wins/GS percentage, RotoWire Todd’s 1s were appropriately the second-worst pitchers in his rankings.
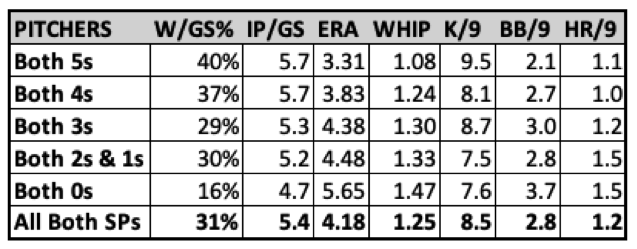
The chart below shows the 69 percent of pitchers that Clay and Todd agreed upon. Again, the pitchers ranked as 5s, 4s, and 0s are quite distinct, with the 5s and 4s performing well above average and the 0s being awful. It’s the pitchers in the middle range that were more difficult to rank, as you might expect, although there is a big drop-off in strikeout rate from the 3s to the 2s, 1s, and 0s, which give the 3s a slight edge.
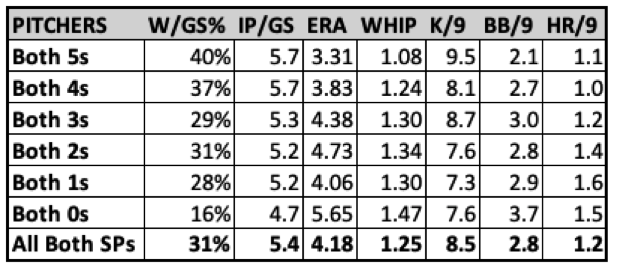
The chart below is similar to the chart above, except that I combined the pitchers ranked 2s and 1s by both Clay and Todd. This produced more distinct tiers, with each higher-ranked pitcher group being better than the lower-ranked groups. Innings per start goes down as the rankings go down, while ERA and WHIP go up. The bottom two groups strike out fewer batters per nine innings than the top three groups. It’s possible a 0 to 4 scale would be an improvement over the 0 to 5 scale because it could create more separation between the groups of pitchers.
When it comes to individual pitchers, there were some top-tier pitchers who lived up to their expectations during their 2-start weeks and other top-tier pitchers who didn’t. Kevin Gausman had five weeks in which Clay and Todd ranked him as a 5 (“start-in-every-league”) and Gausman won 67 percent of those starts with a 1.74 ERA, 1.08 WHIP, and 11.5 K/9. Clayton Kershaw had three weeks in which Clay and Todd ranked him as a 5. He didn’t pitch at all in one of those weeks because he didn’t come off the IL as expected, but in the other two weeks he won half his starts with a 3.25 ERA, 0.90 WHIP, and 10.4 K/9.
On the flip side, Joe Musgrove was given a 5 ranking by both Clay and Todd for five different weeks. He made eight starts during those five weeks, but had just one win, averaged just five innings per starts, and had a 4.28 ERA and 1.35 WHIP. If you’ve had Musgrove on your team, you are likely aware of his frustrating performances in two-start weeks this year.
Many pitchers ranked as 0s by both Clay and Todd pitched like 0s, including three-timer Will Crowe (0 wins, 9.17 ERA, 1.92 WHIP) and four-timer Sam Hentges (0 wins, 8.36 ERA, 1.86 WHIP). Then there was Bailey Ober, who was ranked a 0 by both Clay and Todd three times. During those three weeks, Ober had a 2.79 ERA, 1.09 WHIP, and 9.8 K/9, but only won 25 percent of his starts and averaged just 4.8 innings per start.
For the most part, a pitcher’s ranking one week didn’t stray too far from his rankings for other weeks. Corbin Burnes, for example, was not likely to be ranked 5 one week and 3 the next. The same is true for pitchers across the spectrum. Most 0s were consistent 0s. A 1 might be a 2 or a 0 in a different week, but not very likely to be a 3.
One interesting outlier in this regard was Frankie Montas, who had five prospective two-start weeks in which Clay and Todd agreed on his ranking. During these five weeks, he was ranked by both Clay and Todd as a 5 one time, a 4 one time, a 3 two times, and a 2 one time. His rankings tracked his performance during the season. Coming off a 6.20 ERA in April, Montas was ranked a 2 by Clay and Todd heading into his two-start week on May 3. In late May and late June, he was bumped up to a 3 prior to the week beginning with June 21. After pitching well in July (2.30 ERA), he was ranked a 5 prior to the week beginning August 9 and a 4 heading into the following week (after making just one start from August 9 through August 15). No other pitcher had such a wide range of rankings.
My overall take is that fantasy managers can confidently start pitchers ranked 4s and 5s by Clay and Todd and bench the 0s. The 3s should provide a roughly league average performance, so fantasy managers will have to decide if that’s helpful to their rosters, while the 2s and 1s weren’t that much different from the 3s and were significantly better than the 0s, but also had their drawbacks.

