The Mike Trout WAR Watch
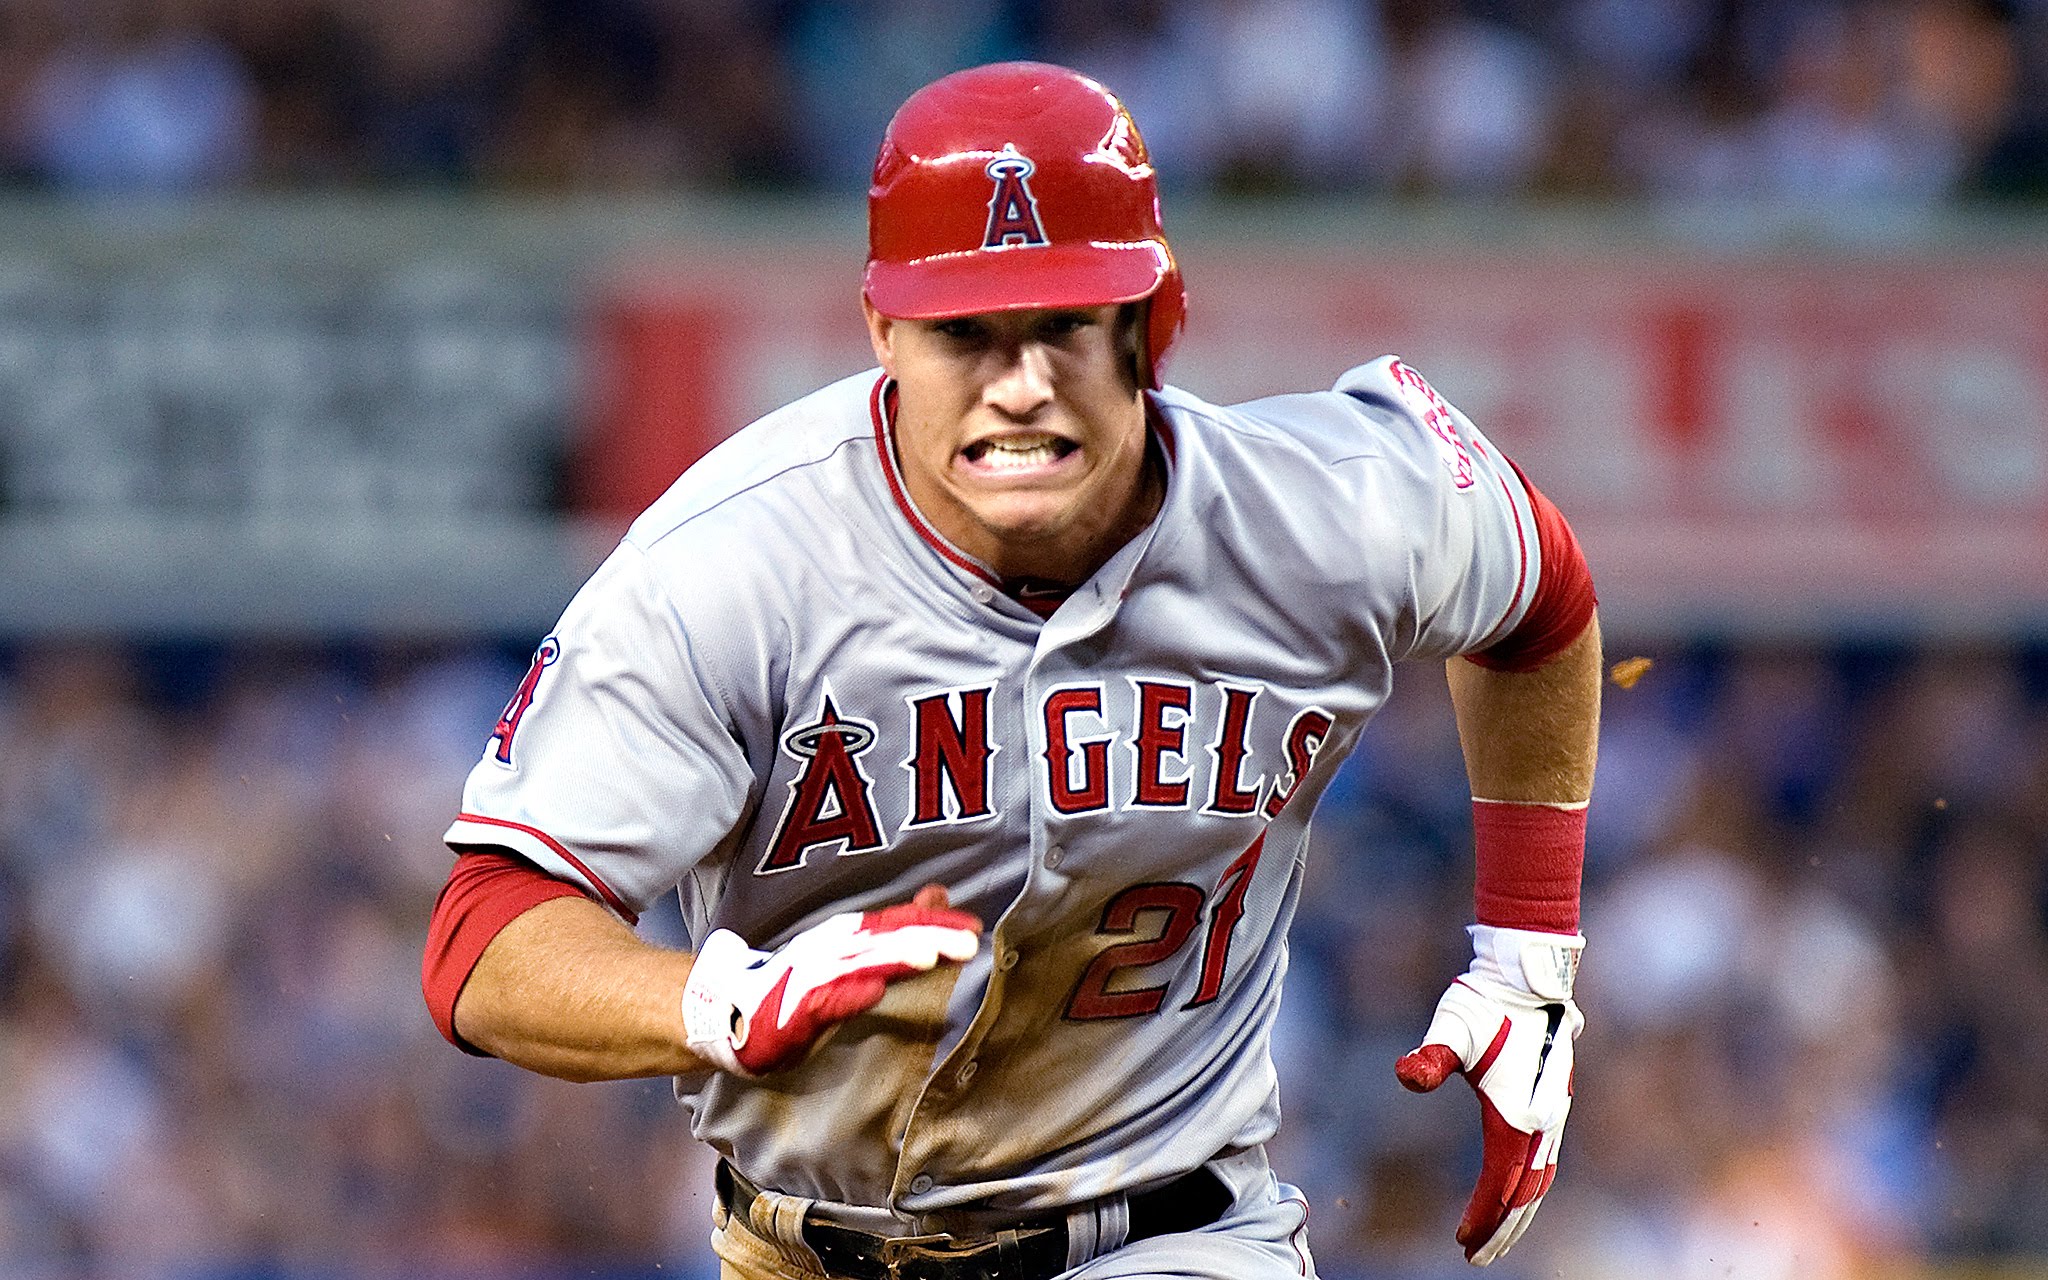
Coming off an eighth consecutive losing season, plus the loss of Shohei Ohtani to free agency, the Los Angeles Angels have become an afterthought in Major League Baseball. They’re projected to win 78 games by FanGraphs, which would be a ninth straight season finishing with a losing record and a tenth straight season without making the playoffs. They didn’t make any major offseason signings. They don’t have any top-tier prospects expected to make an impact this year. They just kind of exist.
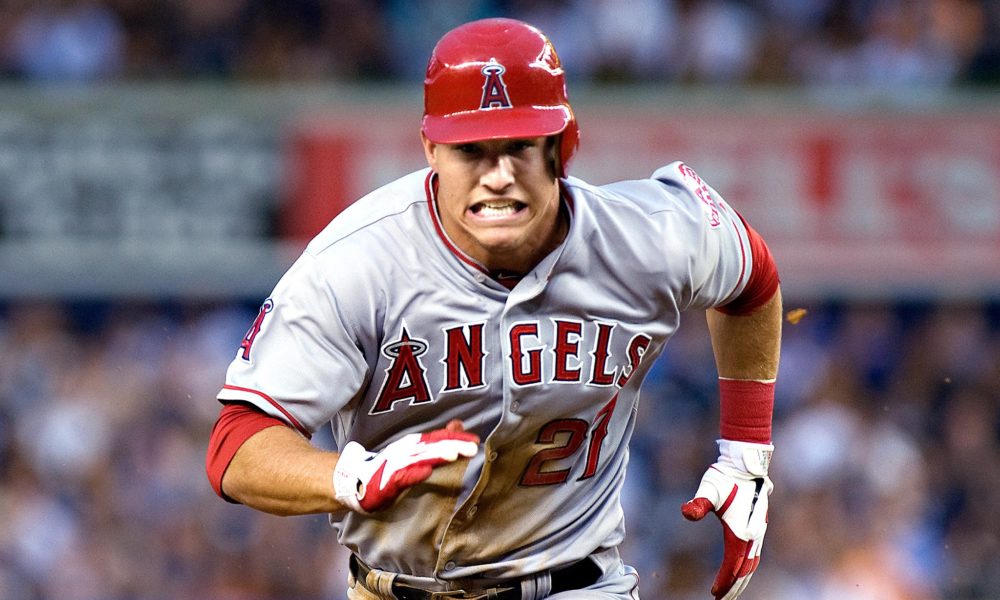
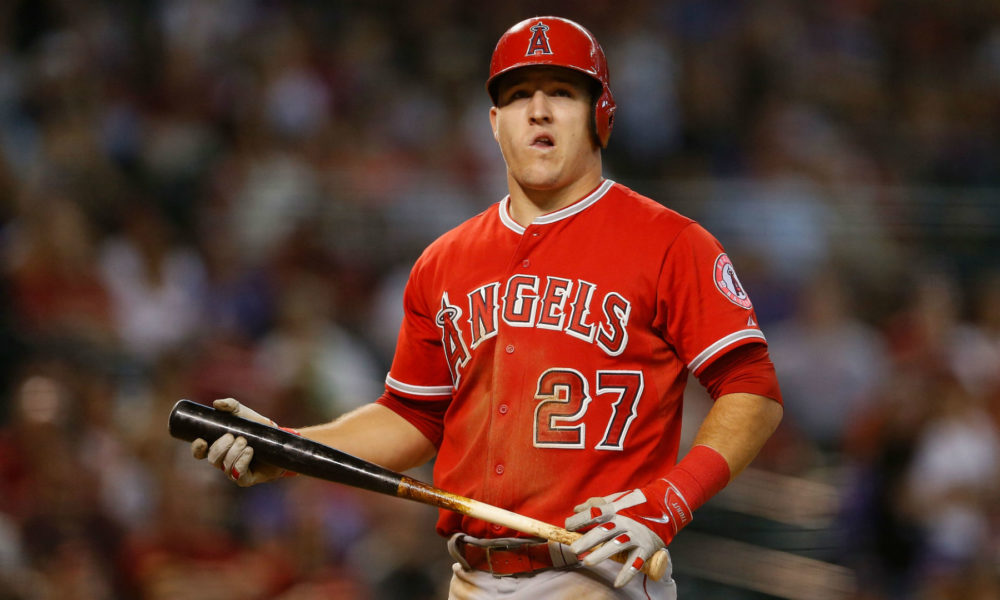
And yet, they have Mike Trout, the 2012 AL Rookie of the Year, 3-time AL MVP, and 11-time All-Star, who is just now entering his age-32 season. I wrote about Trout’s legacy at OTBB just recently.
We all know Trout has struggled to stay on the field the last three seasons. He’s played in just 237 of the Angels’ last 486 games since the start of the 2021 season, which is a little less than half. But he’s still been good when he’s been on the field. Even last year, the worst offensive season he had since his 40-game sample as a rookie, Trout had a 134 wRC+, meaning he was still 34 percent better than league average on offense. He was a 3-WAR player in 82 games, which suggests he would be nearly a 6-WAR player over a full season. That’s still elite. At Baseball-Reference, there were nine hitters and two pitchers who reached that mark last season.
What can we expect going forward? FanGraphs has a number of projection sources for MLB players. One of those, ATC Projections, takes a “wisdom of the crowds” approach by aggregating other projections into one composite projection. ATC projects Trout to play 125 games, get 540 plate appearances and be worth 4.2 WAR.
If Trout lives up to that projection, he’ll pass five Hall of Fame players on the Baseball-Reference WAR leaderboard. If he has a 5-WAR season, he’ll pass seven Hall of Fame players. Let’s take a look at the players Trout is chasing.
52. Mike Trout
85.2 WAR (Baseball-Reference)
6521 Plate Appearances
10.1 WAR in his best season (2013)
51. Chipper Jones
85.3 WAR (+0.1 over Trout)
10614 Plate Appearances
8.0 WAR in his best season (1999)
Despite having 4,000 fewer plate appearances, Trout should pass Jones early in the season. Jones was a first-ballot Hall of Famer (97.2%), 8-time All-Star, and winner of the 1999 NL MVP Award. He’s one of 18 players with 6000 or more plate appearances and a batting average above .300, on-base percentage above .400, and slugging percentage above .500 (.300/.400/.500 Club). (Hat tip, Stathead by Baseball-Reference)
Trout is also in the .300/.400/.500 Club, but his career batting average is .301 and he’s hit just .283 over the last four years, including .263 last year. He’s much more likely to drop below .300 than to maintain that average over the last half of his career.
Of course, the biggest difference between Chipper Jones and Mike Trout is that Jones made the playoffs with Atlanta 12 times, including 11 years in a row from 1995 to 2005. Trout has one playoff appearance in his career.
50. Robin Roberts
86.2 WAR (+1.0 over Trout)
4688.7 Innings Pitched
9.8 WAR in his best season (1953)
Robin Roberts was a workhorse pitcher for 19 big league seasons, with the best of those being with the Philadelphia Phillies in the 1950s. The sheer volume of innings he put up show how much baseball has changed in the last 70 years:
1950—20 W, 39 GS, 21 CG, 304.3 IP
1951—21 W, 39 GS, 22 CG, 315.0 IP
1952—28 W, 37 GS, 30 CG, 330.0 IP
1953—23 W, 41 GS, 33 CG, 346.7 IP
1954—23 W, 38 GS, 29 CG, 336.7 IP
1955—23 W, 38 GS, 26 CG, 305.0 IP
1956—19 W, 37 GS, 22 CG, 297.3 IP
Last season, all MLB pitchers combined had 35 complete games. Roberts had 33 complete games by himself in 1953.
49. Tim Keefe
86.9 WAR (+1.7 over Trout)
5049.7 Innings Pitched
19.9 WAR in his best season (1883)
Remember all those innings pitched by Robin Roberts? Tim Keefe says, “Hold my beer.”
1881—18 W, 45 GS, 45 CG, 403.0 IP
1882—17 W, 42 GS, 41 CG, 376.0 IP
1883—41 W, 68 GS, 68 CG, 619.0 IP
1884—37 W, 58 GS, 56 CG, 483.0 IP
1885—32 W, 46 GS, 45 CG, 400.0 IP
1886—42 W, 64 GS, G2 CG, 535.0 IP
1887—35 W, 56 GS, 54 CG, 476.7 IP
1888—35 W, 51 GS, 48 CG, 434.3 IP
1889—28 W, 45 GS, 39 CG, 364.0 IP
48. George Brett
88.6 WAR (+3.4 over Trout)
11625 Plate Appearances
8.5 WAR in his best season (1980)
“Know what the difference between hitting .250 and .300 is? It’s 25 hits. Twenty-five hits in 500 at bats is 50 points, okay? There’s six months in a season, that’s about 25 weeks. That means if you get just one extra flare a week – just one – a gorp… you get a groundball, you get a groundball with eyes… you get a dying quail, just one more dying quail a week… and you’re in Yankee Stadium.
“Know what the difference between hitting .250 and .300 is? It’s 25 hits. Twenty-five hits in 500 at bats is 50 points, okay? There’s six months in a season, that’s about 25 weeks. That means if you get just one extra flare a week – just one – a gorp… you get a groundball, you get a groundball with eyes… you get a dying quail, just one more dying quail a week… and you’re in Yankee Stadium.“
— Crash Davis (Bull Durham)
Another first-ballot Hall of Famer (98.2%), Brett was a 13-time All-Star who famously hit .390 in 1980 on his way to the AL MVP Award. He was eight hits short of a .400 season. That’s about one extra flair, gorp, ground ball with eyes, or dying quail every three weeks.
47. Bob Gibson
89.1 WAR (+3.9 over Trout)
3884.3 Innings Pitched
11.2 WAR in his best season (1968)
Bob Gibson had 13 shutouts during his incredible 1968 season (1.12 ERA in 304.7 IP). No pitcher has topped him since. The last time a pitcher had even five shutouts in a season was in 2012, when Justin Verlander accomplished it. The MLB leader(s) in shutouts over the last 10 seasons (minus 2020):
2023—2 shutouts: Gerrit Cole, Framber Valdez
2022—1 shutout: 16 pitchers
2021—2 shutouts: Zack Wheeler, Joe Musgrove, Anthony DeSclafani, Max Fried, Sean Manaea
2019—3 shutouts: Lucas Giolito, Sandy Alcantara, Shane Bieber
2018—1 shutout: 19 pitchers
2017—3 shutouts: Corey Kluber, Ervin Santana
2016—3 shutouts: Clayton Kershaw
2015—3 shutouts: Clayton Kershaw, Max Scherzer, Jake Arrieta
2014—3 shutouts: Adam Wainwright, Rick Porcello, Henderson Alvarez
2013—2 shutouts: Bartolo Colon, Justin Masterson
46. Gaylord Perry
90.0 WAR (+4.8 over Trout)
5350.0 Innings Pitched
10.8 WAR in his best season (1972)
If Mike Trout can land in between his 2022 season total of 6.3 WAR and his projection of 4.2 WAR, he would catch Gaylord Perry and Steve Carlton on the all-time leaderboard. He would likely have around 7100 plate appearances, which is about a third of the numbers of batters faced by Gaylord Perry in his career (21953). Perry was part of a group of pitchers in the 1960s and 1970s who regularly pitched 300 innings and faced more than 1100 batters in a season. In contrast, the 2023 leader in batters faced was Miles Mikolas, with 860. Perry led the league with 1345 batters faced in 1969.
45. Steve Carlton
90.2 WAR (+5.0 over Trout)
5217.7 IP
12.1 WAR in his best season (1972)
A 5.1-WAR season by Mike Trout would move him past Steve Carlton to 45th on the all-time list after 14 seasons. Carlton pitched for 24 seasons. He was a 10-time All-Star and won 4 Cy Young Awards. His signature season was in 1972, when he was 27-10 with a 1.97 ERA and 310 strikeouts in 346.3 innings. The Phillies won 59 games in 1972. Last year’s Kansas City Royals won 56 games. Imagine if they had a pitcher win 25 of them. Social media would implode.
Baseball is better when Mike Trout is healthy and hitting bombs. He may not single-handedly drag the Angels to the playoffs this season, but if he can stay healthy and continue to be the player he’s been, he’ll zoom right past a handful of Hall of Fame players on the all-time WAR leaderboard.

