Fantasy Baseball Clues in the 2022 Pitcher Projections
I wrote about hitter projections for the 2022 season recently. Now it’s time to look at the pitcher projections for the 2022 season. First, here are the projections I used for this piece.
Projection Systems—A Primer
- Marcels—created by Tom Tango, Marcels is short for Marcel the Monkey Forecasting System. It is the most elementary forecasting system of them all. It uses three years of MLB data, with the most recent data weighted heavier. It regresses to the mean and has an aging factor. Many of the other systems build off the Marcels framework, using some number of years of data, with the most recent data weighted heaver, some regression to the mean, and an age factor. Then they add their own “special sauce.” Marcels projections are typically more conservative with playing time. Notice that Marcels projects fewer at-bats than the others for Vlad and Bo in the tables above.
- ATC—created by Ariel T. Cohen, ATC stands for Average Total Cost Projection System (while also conveniently being Ariel’s initials). It combines many other projections along with the player’s prior MLB statistics into a “composite” projection. It’s a “wisdom of the crowd” approach.
- THE BAT—created by Derek Carty, THE BAT is short for The How to Excel (at DFS) Baseball Algorithmic Tool. It starts as a comprehensive projection system like Marcels, then adds additional information for daily fantasy players, including platoon splits, role, lineup position, and more.
- CBS—these are the projections from CBS Sportsline. I don’t know the background of these projections, such as who creates them or what kind of system generates the numbers.
- Clay Davenport—Clay Davenport co-founded Baseball Prospectus in 1996. Among other things, he crated Davenport Translations, which are estimated Major League equivalent performance statistics for minor league and international players. He is no longer affiliated with BP, but still runs his own website and creates projections each year.
- Rotowire—these arethe projections from Rotowire. As with CBS, I don’t know the background of these projections.
- PECOTA—published at Baseball Prospectus, PECOTA stands for Player Empirical Comparison and Optimization Test Algorithm, which is a fancy way of saying it uses past performance and comparable players to project the most likely outcome for the upcoming season.
- Steamer—created by Jared Cross, Peter Rosenbloom, and Dash Davidson, Steamer projections started with the basic Marcels framework and built upon it.
- ZiPS—created by Dan Szymborski, ZiPS is like Marcels and Steamer in that it uses a weighted average of past performance, but with four years for most hitters rather than three. It also identifies comparable players to create an estimate of future improvement or decline.
- ATC, THE BAT, Steamer, and ZiPS projections can all be found at FanGraphs.
- The projections used for this article were gathered between February 8 and 14.
The Big Picture—Projection Systems Comparison
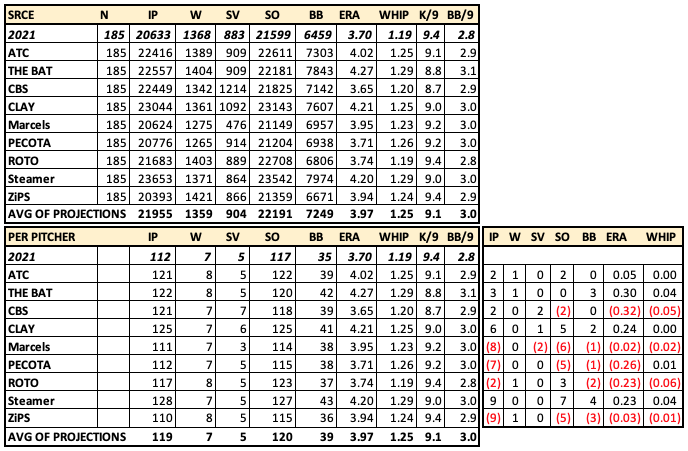
The chart below is based on 185 pitchers who pitched in 2021 and have projections for 2022 from these nine sources. This includes 122 starting pitchers and 63 relievers. In 2021, these pitchers combined for a 3.70 ERA and 1.19 WHIP, as shown in the top row of the upper chart. The nine sources averaged together project these same pitchers to have a 3.95 ERA and 1.24 WHIP in 2022 (bottom row of upper chart). Below that are the projections per pitcher.
There’s a wide range among the projections, from the 3.65 ERA projected by CBS to the 4.27 ERA projected by THE BAT. The difference in projected WHIP runs from a low of 1.19 by Rotowire to a high of 1.29 from THE BAT. The chart on the bottom right shows how each individual projection system compares to the average of them all.
As I pointed out with the hitter projections in my previous article, the difference in projected ERA among the systems suggests they are projecting different run-scoring environments. A comprehensive look would include many more players to most accurately gauge how many runs per game each source projects, but even with this smaller sample of pitchers, the difference is informative.
Before we get take a closer look at the pitching projections, let’s bring back the hitter projections from my previous article, focusing on run scoring.
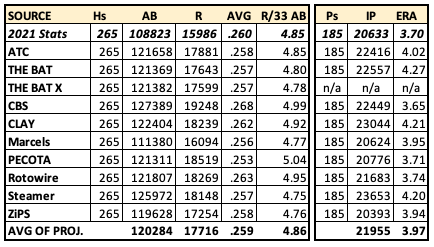
Note: THE BAT X doesn’t project pitchers. Also, runs per 33 at-bats (R/33 AB) is a proxy for runs per game. In 2021, there were about 33 at-bats per team per game.
It’s important to remember that this isn’t a comprehensive look at every player who is expected to play in the big leagues in 2022. These are generally average to above-average hitters and pitchers. The 265 hitters from my previous article are projected for roughly 120,000 at-bats, which is about 75% of the total at-bats in a season (based on 2021’s 161,941 total at-bats). The 185 pitchers are projected for around 22,000 innings, which is roughly 52% of total innings pitched in a season (based on 2021’s 42,615 innings).
That being said, they are the same group of hitters and pitchers being projected by all the sources, so it’s fair to wonder why CBS has these 265 hitters projected to score 4.99 R/33 AB and these 185 pitchers to have a 3.65 ERA, while Clay Davenport has the same hitters scoring 4.92 R/33 AB and the same pitchers projected for a 4.21 ERA. I don’t know the behind-the-scenes workings of the CBS projections, but I do know that Clay Davenport states on his website that “These player projections have been manipulated to produce league totals that match the average values from the 2021 season.” Presumably, his projections are based on the same offensive environment for hitters and pitchers. It seems unlikely that CBS is doing this.
The different run scoring environments make a large difference when comparing individual projections. If this group of pitchers is projected by CBS to have a 3.65 ERA, then a pitcher projected by CBS to have a 4.00 ERA is worse than the average pitcher in this group. On the other hand, Clay Davenport projects this group of pitchers to have a 4.21 ERA, so a pitcher projected by Davenport to have a 4.00 ERA is better than the average from this group. If you’re looking at particular pitchers through the lens of multiple sources, whether for fantasy baseball purposes or not, it’s good to know what the pitcher projections have different averages; .the context for a pitcher projection matters.
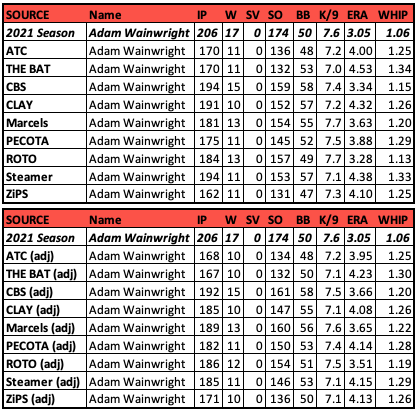
Adam Wainwright is an interesting example. He’s projected by CBS to have a 3.34 ERA. PECOTA has him about a half-run higher, at 3.88. Clay Davenport has him another half-run higher than PECOTA, at 4.32. At the high end, THE BAT projects a 4.53 ERA. That’s a significant range in projected ERA (3.34 to 4.53).
Now we have to consider that the 3.34 ERA projection for Wainwright is from CBS, which projects this entire group of pitchers to have a 3.65 ERA, while the 4.32 ERA is from Clay Davenport, who projects the entire group to have a 4.21 ERA. One way to put the projections on a similar playing field is to adjust them all to the same projected ERA as the average of all the projection sources, which would be a 3.97 ERA.
The quick-and-dirty way to adjust them is to add 0.32 to each pitcher’s projection from CBS and subtract 0.24 from each pitcher’s projection from Clay Davenport. This adjustment narrows the gap from the original 3.34 and 4.53 (a gap of 1.19 in ERA) to 3.66 and 4.08 (a gap of 0.42). The chart below shows the original projections on top and the new numbers on bottom for Wainwright once this adjustment has been made for all sources.
Pitchers With Consistent Projections
The players shown below are prominent pitchers with among the most agreement from the projection sources on the statistics they’ll produce in 2022. This is after the adjustments mentioned above have been applied to put all the projection sources on a level playing field with the same expected ERA and WHIP.
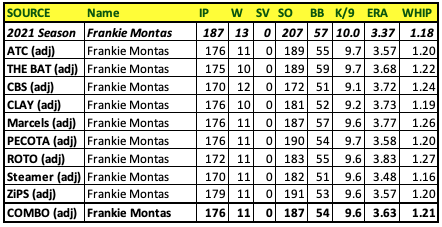
Frankie Montas has had some wild swings in ERA and WHIP over the last four years, but the general consensus among the projections this year, after adjustments, is for an ERA in the 3.57 to 3.77 range, and a WHIP centered around 1.20. He’s also projected for 170 to 179 innings from all nine sources after a career-high 187 innings last year and looks to win 11 games based on the consensus.
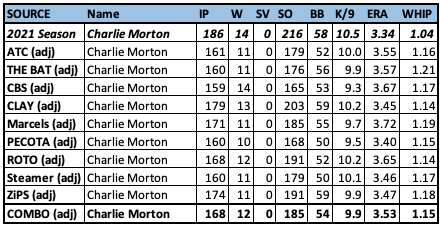
The 3.53 ERA from the average of all nine projection sources is essentially what Charlie Morton’s SIERA has been in three of the last four seasons. SIERA is an ERA estimator from FanGraphs that is considered to be slightly more predictive than xFIP, another ERA estimator. Morton’s SIERA over the last four years has been 3.52, 3.54, 3.97, 3.53, while his actual ERAs have been 3.13, 3.05, 4.74, and 3.34. Despite being 38 years old, the projections think “same old, same old” when it comes to Charlie-Mo.
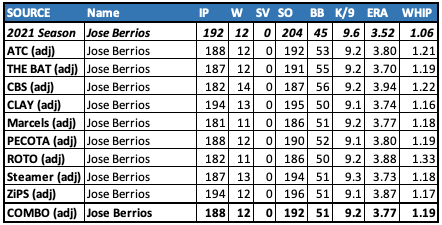
Jose Berrios has had an ERA between 3.52 and 4.00 in each of the last five seasons and the nine projection sources expect more of the same. For the most part, they expect a WHIP in the 1.16 to 1.19 range, with Rotowire’s 1.33 WHIP projection being a significant outlier. Berrios has also been a consistent 190-200 innings pitcher in the last three full seasons and should be in the 185-195 range in 2021.
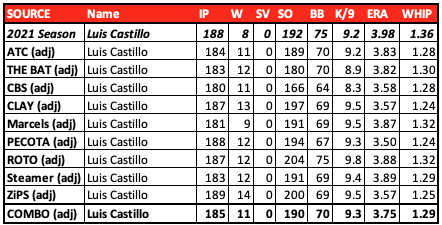
After Luis Castillo’s inconsistent 2021 season, when he had a 4.65 ERA in the first half and a 3.18 ERA in the second, he’s being projected for an adjusted ERA in the 3.50 to 3.57 range by four sources and in the 3.82 to 3.89 range by five sources, so you could say there are two schools of thought on Castillo’s likely ERA. A bit under half see him as a 3.55 ERA guy and a bit over half see him as a 3.85 ERA guy. The sources all pretty much agree on his innings pitched total.
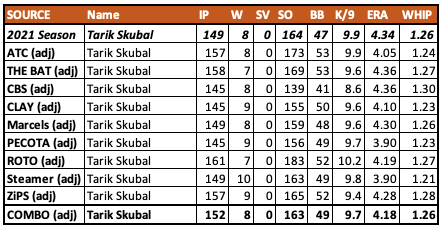
Tarik Skubal’s consensus projection looks similar to what he did last season: 149.3 IP, 8 W, 9.9 K/9, 4.34 ERA, 1.26 WHIP. PECOTA and Steamer are a little higher on him, while THE BAT and CBS are less optimistic.
Pitchers With Varying Projections
The following pitchers with some diverse projections include some who suffered through injuries last year, a former top pitching prospect, and one of 2021’s biggest surprises.
Reminder, these are the projections after the adjustments mentioned above have been made to equalize the playing time and run scoring environment across the entire group of pitchers.
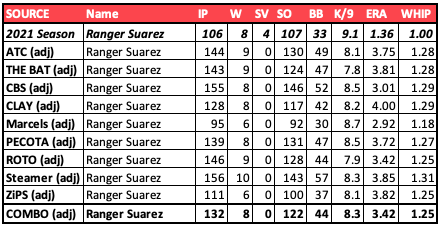
Ranger Suarez went into last season with a career 4.66 ERA (4.26 SIERA). Then he started the year in the Phillies bullpen and had a 1.12 ERA in his first 27 outings. That earned him a spot in the starting rotation, where he proved to be nearly as good as he’d been in the pen, putting up a 1.51 ERA in 65.7 innings across 12 starts. Overall, he had a 1.36 ERA, but it came with a much more realistic and reasonable 3.51 SIERA. The average of all the projections have him with a 3.42 ERA, but the spread is from a 2.92 ERA projected by Marcels to the 4.00 ERA projected by Clay Davenport (after adjustments). Suarez also has diverse innings projections that range from 95 innings by Marcels and 111 by ZiPS to 155 by CBS and 156 by Steamer.
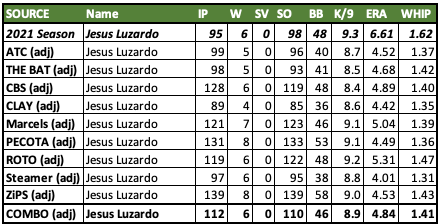
Jesus Luzardo’s adjusted projections range from a usable 4.01 ERA/1.31 WHIP (Steamer) to a waiver wire fodder 5.31 ERA/1.47 WHIP (Rotowire). In his three-year career, he has an ugly 5.36 ERA, but his xFIP (4.39) and SIERA (4.36) are fairly close to his Clay Davenport adjusted projection of 4.42. He’ll be 24 years old in 2022 and pitching for the Marlins, so maybe they can help him fulfill the promise he had when he was a top-10 prospect prior to the 2020 season.
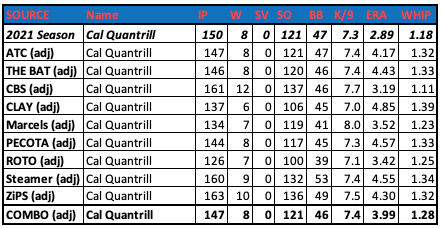
Cal Quantrill had a 2.89 ERA in 2021 that came with a 4.52 SIERA. For 2022, CBS (3.19 ERA), Marcels (3.52 ERA), and Rotowire (3.42 ERA) are buying in to Quantrill being an effective pitcher. Clay Davenport (4.85 ERA), PECOTA (4.57 ERA), and Steamer (4.55 ERA), beg to differ.
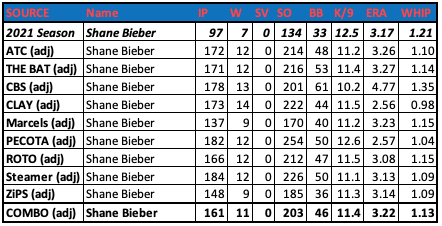
After injury limited him to 96.7 innings last season, Shane Bieber has a 47-inning gap between his Marcels adjusted projection and Steamer. The range in projected wins goes from nine by Marcels and ZiPS to 14 by Clay Davenport, who also projects by far the best ERA/WHIP numbers (2.56 ERA, 0.98 WHIP). In fact, the pitcher Clay Davenport expects Bieber to be is very different from the pitcher CBS is projecting (4.77 ERA, 1.35 WHIP).
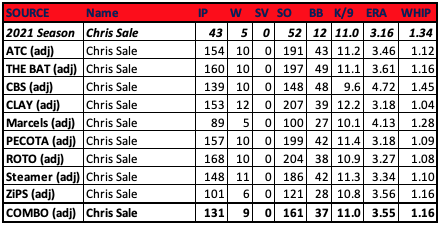
Like with Shane Bieber above, CBS is not a big fan of Chris Sale, giving him an adjusted projected ERA of 4.72 and a 1.45 adjusted WHIP. Even CBS’ unadjusted projection of a 4.40 ERA and 1.40 WHIP would be uncharted territory for the lefty. He’s had an ERA that high once in 11 years and never had a WHIP higher than last year’s 1.34. The range of projected innings pitched is large for Sale, from 89 and 101 innings by Marcels and ZiPS to 160 and 168 by THE BAT and Rotowire.
Other Notable Numbers
I went through the data to find the greatest and lowest standard deviations for a few pitching categories based on the projections from the nine sources. A greater standard deviation means those players have more dispersed projections compared to the mean. This is after the aforementioned adjustments to the projections have been made to put them in the same expected offensive environment.
Innings Pitched
- Greatest standard deviation in innings pitched: Chris Sale (ranges from 89 IP to 168), Zack Greinke (48 to 173), Trevor Bauer (47 to 145)
- Lowest standard deviation in innings pitched: Luis Castillo (180 to 189), Kyle Hendricks (168 to 180), Lucas Giolito (175 to 188)
Chris Sale missed all of the 2020 season and much of the 2021 season, so his innings projections have a wide variance. Greinke will be 38 years old and has not yet signed with a team, which makes his status somewhat up in the air. The same is true for Trevor Bauer, but for very different reasons, as he is still awaiting the outcome from MLB’s ongoing investigation into a potential violation of the domestic violence policy stemming from sexual assault allegations against him.
Luis Castillo, Kyle Hendricks, and Lucas Giolito all have a low standard deviation for their innings pitched projections from the nine sources. They should be good for around 30 starts and 175-185 innings.
ERA
- Greatest standard deviation in ERA: Joe Barlow (ranges from 1.94 ERA to 4.85 ERA), Drew Steckenrider (2.32 to 4.50), Ranger Suarez (2.92 to 4.00)
- Lowest standard deviation in ERA: Miles Mikolas (4.00 to 4.35), Jose Berrios (3.70 to 3.94), Jameson Taillon (4.13 to 4.53)
Last year, reliever Joe Barlow of the Texas Rangers pitched 29 innings with a 1.55 ERA, but his ERA estimators were not nearly as good—3.45 FIP, 4.56 xFIP, 4.18 SIERA. His adjusted projections this year are all over the place:
- 1.94—CBS (adj)
- 2.89—Rotowire (adj)
- 3.55—THE BAT (adj)
- 3.62—Marcels (adj)
- 3.96—ATC (adj)
- 4.22—Steamer (adj)
- 4.65—PECOTA (adj)
- 4.77—Clay Davenport (adj)
- 4.85—ZiPS (adj)
Whatever you personally think Joe Barlow will do in 2022, you can find a projection that agrees with you. Drew Steckenrider and Ranger Suarez are on the list with Barlow, but not quite to his extreme. Mikolas, Berrios, and Taillon are on the other end of the spectrum, with not nearly as much variation in their projected ERAs.
WHIP
- Greatest standard deviation in WHIP: Joe Barlow (ranges from a 0.89 WHIP to 1.56 WHIP), Camilo Doval (0.99 to 1.49), Tanner Scott (1.28 to 1.76)
- Lowest standard deviation in WHIP: Jameson Taillon (1.23 to 1.28), Brad Hand (1.22 to 1.28), Dylan Bundy (1.29 to 1.35)
Much like with ERA, Barlow’s projected WHIP is all over the place: 0.89, 1.16, 1.17, 1.32, 1.38, 1.38, 1.43, 1.45, 1.56. When you average his adjusted projections, you get a pitcher with a 3.74 ERA, 1.29 WHIP, and about 20 saves, which would be useful in any league, but the range of outcomes is wide.
Camilo Doval is a popular potential closer with a 176 ADP at NFBC for drafts from February 1 through February 16, right in the mix with Lance McCullers Jr., Nelson Cruz, Mitch Garver, Ranger Saurez, and Clayton Kershaw. His best adjusted projection is for a 3.13 ERA and 0.99 WHIP from CBS and his worst adjusted projection is for a 4.19 ERA and 1.39 WHIP from PECOTA. The average of all nine is a 3.65 ERA and 1.29 WHIP.
Taillon, Hand, and Bundy are bland veterans with similar projected WHIPs from all the sources. The projections average out to a 1.24 WHIP for Taillon, 1.26 WHIP for Hand, and 1.32 WHIP for Bundy.
PECOTA Goes Where No Projections Have Gone Before
Setting aside adjusted projections and just looking at the actual projections, we find Baseball Prospectus’ PECOTA projecting Jacob deGrom for a 1.42 ERA in 133 innings in 2022. This would be a regression from deGrom’s ridiculous 1.08 ERA last year, but it’s still not a projection you would ever expect to see. Projections based on computer models universally regress a player’s statistics enough to bring up the lows and pull down the highs. The other projections generally have deGrom in the 2.30 to 2.60 range in ERA. Clay Davenport is closest to PECOTA, with a 2.13 ERA projected for deGrom. Seriously, 1.42 is something else.
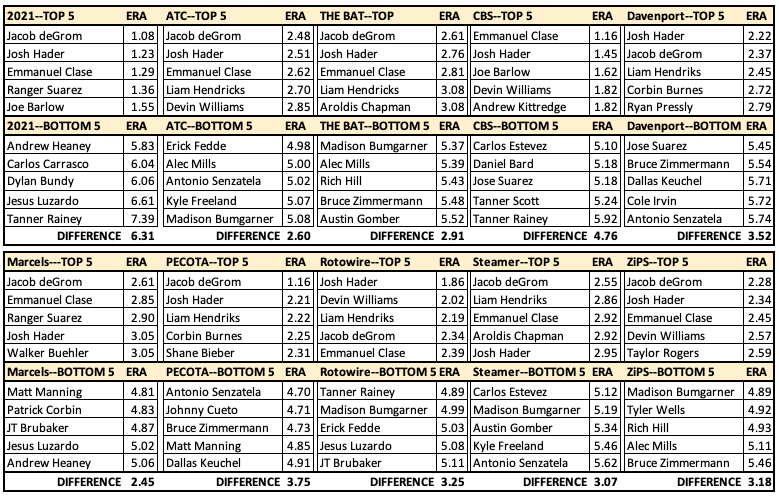
The chart below shows the lowest and highest projected ERAs from each source, along with the difference from the lowest to highest and the standard deviation in ERA for all 185 pitchers. The actual statistics for this group of pitchers from 2021 have the widest range in ERA and the greatest standard deviation, which is what we would expect. As mentioned above, projections use regression to bring all projections closer together, raising the lows and lowering the highs.
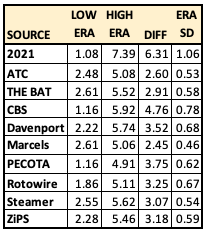
The baseline Marcels projections, which is often the framework for other computer-generated projections, has the lowest standard deviation for these pitchers and the least difference between the highest projected ERA and lowest. This is what we would expect because of the regression component of Marcels. ATC, which blends multiple other projections into one has the second-lowest standard deviation and second-lowest difference between the highest and lowest projected ERA, which also tracks with what we know and would expect from ATC.
To get an idea of the upper and lower ranges of ERA projected by these sources, consider the chart below that shows the top five projected ERAs and the bottom five projected ERAs for each source, along with the actual 2021 top five and bottom five.
Again, I ask: CBS, What Are You Doing?!
The CBS projections had surprising numbers for some position players, which I pointed out in the article about hitters that came out recently. The same is true for many pitcher projections.
I found the greatest difference in projected ERA from each individual source compared to the average of all nine sources. CBS held the top 12 spots for pitchers with a lower projected ERA than the average. These are the 13 pitchers that CBS loves far more than the consensus:
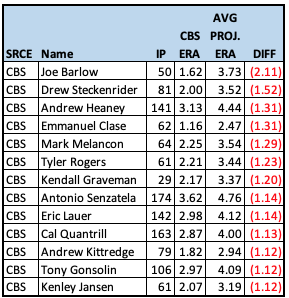
Remember, though, that CBS projects this entire group of pitchers for the lowest ERA of all the sources, which is why I was adjusting the numbers previously. When we use the adjusted numbers, CBS still has the top seven spots, but not the top 13. They also have four of the bottom five spots when it comes to ERAs projected to be higher than the average of the nine sources, after adjustments have been made. The two biggest names with higher projected ERAs than the average are Chris Sale and Shane Bieber, whose numbers were shown earlier.
More than the other sources, CBS projections are a thing of their own. They correlate less to ATC, which is a composite of projections. They also correlate less to Marcels, a baseline projection system. If you go into a draft or salary cap league using CBS projections, you’ll be dancing to the beat of your own drum on many of these players.


